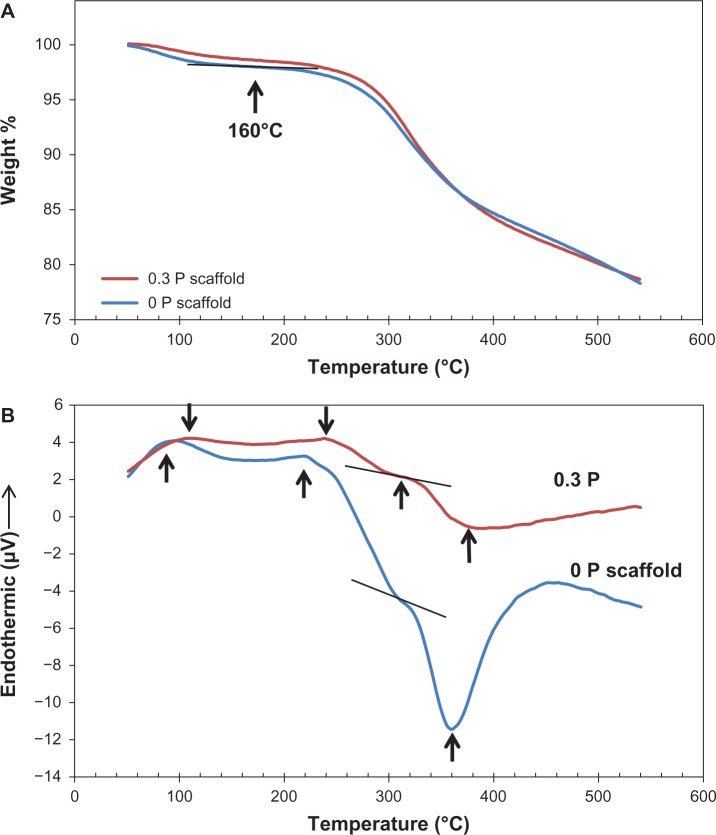
Figure 7.
(A) Thermal gravimetric analysis and (B) differential scanning calorimetry curves of the 0 P and 0.3 P scaffolds. Four thermal stages can be observed in the differential scanning calorimetry plot (water loss, decomposition, pyrolysis, and oxidative degradation). The location of the peaks shows a slight shift to the right for the 0.3 P scaffold.
Notes: 0 P and 0.3 P represent the scaffolds prepared from 0% and 0.3% (w/w) poly(3,4-ethylenedioxythiophene) poly(4-styrene sulfonate) in the mixture of 10% (w/v) gelatin and 30% (w/v) bioactive glass nanoparticles.

