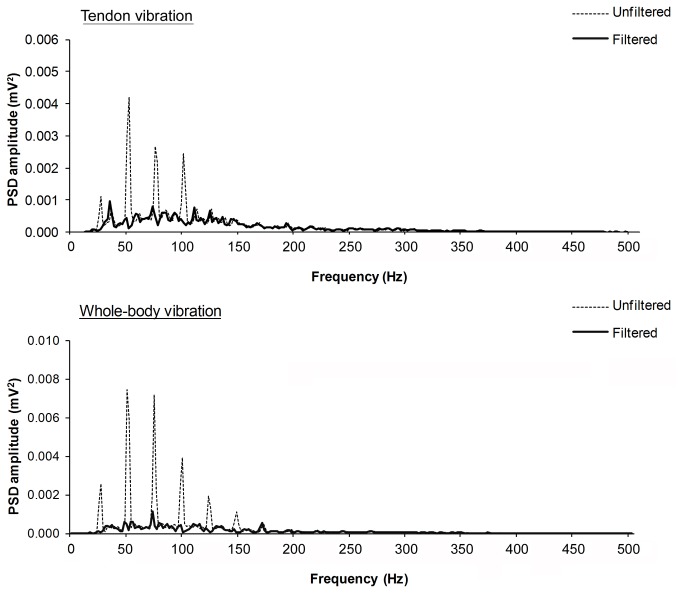
Figure 1. Example of the power spectral density (PSD) distribution of the EMG signal recorded from the m.
soleus during either tendon vibration or whole-body vibration (25Hz, 1.5mm) before (unfiltered, dashed line) and after (filtered, black line) applying the ‘spectral smoothing’ procedure to attenuate vibration artefacts.

