
Figure 1. C5 deposition by Western blot Analysis. C5α levels in sham and BCAS mice at thirty days in A) whole brains and B) corpus callosum homogenates.
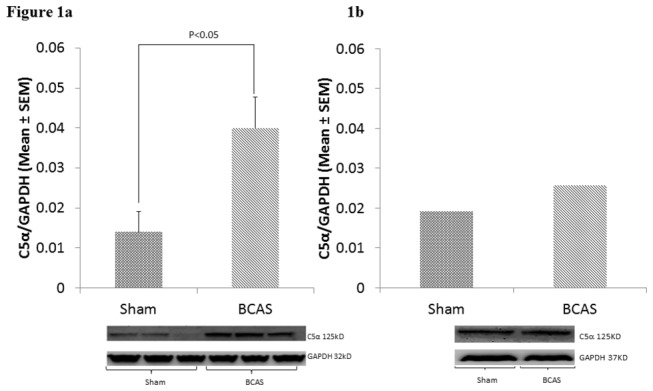
Bottom: Western Blots. Top: Relative C5α densities represented graphically (mean±SEM). Error bars are not presented in Figure 1b, as homogenates of three separate corpus callosum samples are combined into a single sample for each group (due to relatively small amount of tissue obtained from each corpus callosum dissection, n=3 for whole brain, n=3 for corpus callosum homogenates).