
Figure 2. C5 deposition timeline by Western blot Analysis. C5α levels in BCAS mice at day 1 (n=3), 15 (n=3), and 30 (n=3).
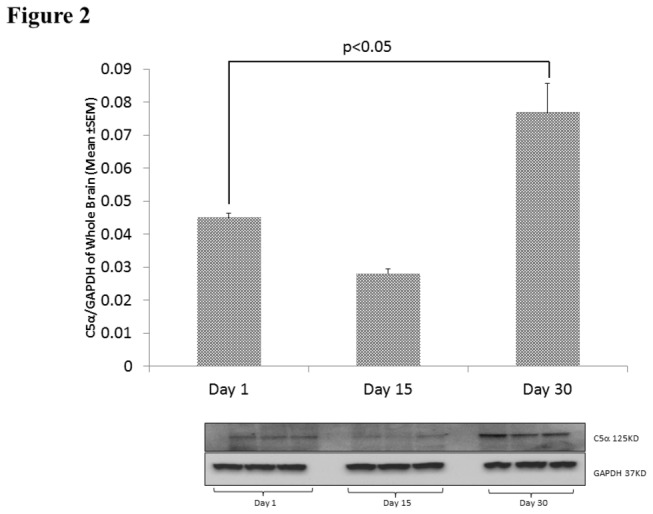
Bottom: Western Blots. Top: Relative C5α densities represented graphically (mean±SEM).
Official websites use .gov
A
.gov website belongs to an official
government organization in the United States.
Secure .gov websites use HTTPS
A lock (
) or https:// means you've safely
connected to the .gov website. Share sensitive
information only on official, secure websites.
Bottom: Western Blots. Top: Relative C5α densities represented graphically (mean±SEM).