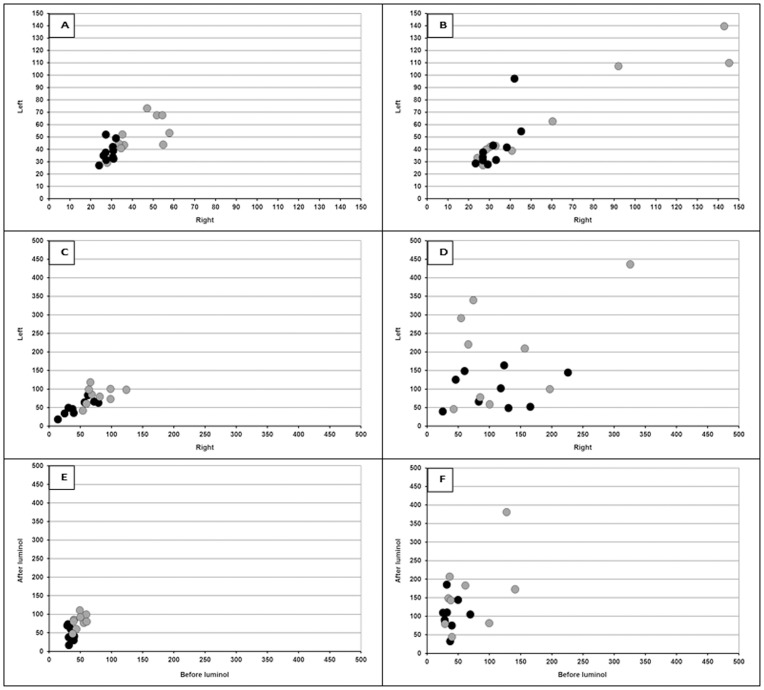
Figure 3. The relationship of UPE intensity between left and right paws.
The upper panel presents the left and right intensity values of hind (black •) and front (gray •) paws before luminol injection for the control (Figure 3A) and CII-injected animals (Figure 3B). The middle row of panels of Figure 3 illustrates left and right symmetry in intensity of hind (black circles) and front (grey circles) paws after luminol injection for the control (Figure 3C) and CII injected animals (Figure 3D). The lower panels compares baseline UPE intensity (before luminol) of individual animals with the corresponding increased UPE value after luminol injection of the same animals. The relationship of UPE intensity within an animal (before and after luminol injection) for hind (black circles) and front (grey circles) paws is depicted for the control group (Figure 3E) and CII-injected group (Figure 3F).

