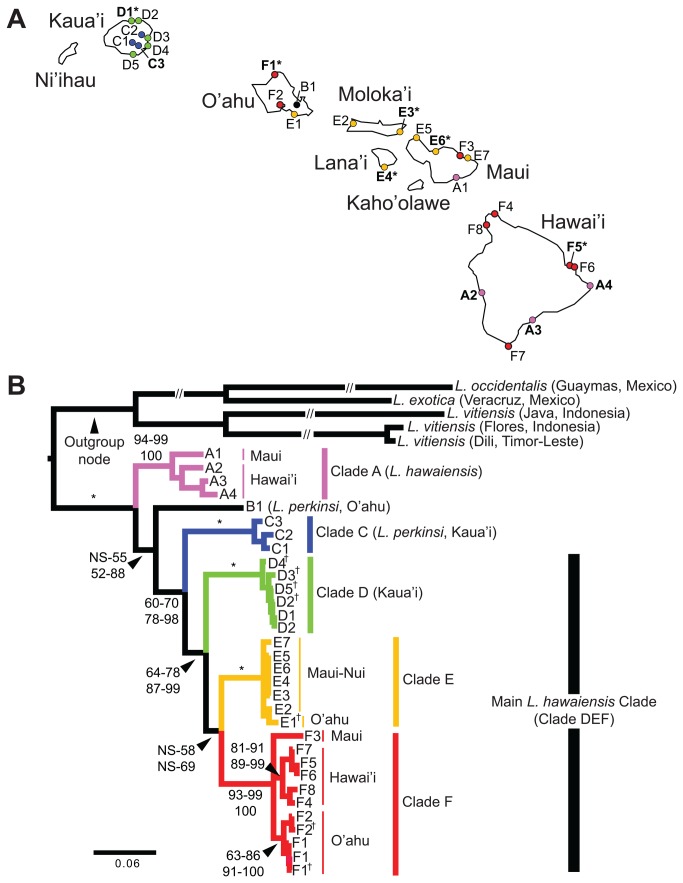
Figure 1. Sampled localities (A) and inferred phylogeny (B) of Ligia lineages endemic to the Hawaiian Archipelago.
Color-coding and labels correspond between panels and with other figures and tables. Detailed information for each locality is presented in Table S1. A. Sampled localities for supralittoral L. hawaiensis: D1-Kapua'a Beach Park, D2-Kauapea Beach, D3-Kapa'a, D4-Lihu'e, D5-Kukui'ula (Kaua’i Island); E1-Ala Wai Canal, F1-Pupukea, F2-Pouhala Marsh (O’ahu Island); E2-Papohaku Beach Park, E3-North of Puko'o; Lana’i: E4-Manele Bay (Moloka’I Island); A1-Waiopai, E5-Poelua Bay, E6-Spreckelsville, E7-Keanae, F3-Honomanu Bay (Maui Island); A2-Kealakukea Bay, A3-Pu'unalu Beach Park, A4-Isaac Hale Beach Park, F4-Keokea Beach, F5-Onekahakaha Beach Park, F6-Leleiwi Beach, F7-South Point, F8-Kapa'a State Park (Hawai’i Island). Sampled localities for terrestrial L. perkinsi: C1-Mt Kahili, C2-Makaleha Mts, C3-Haupu Range (Kaua’i Island); B1-Nu'uanu Pali (O’ahu Island). Boldfaced labels indicate localities used in the nuclear analyses. * indicates localities examined in the geometric morphometric analyses. B. Majority rule consensus tree (GTR +Γ model in RaxML; TreeBase http://purl.org/phylo/treebase/phylows/study/TB2:S14886) of the concatenated mitochondrial dataset of Ligia samples from the Hawaiian Archipelago and several outgroups. Numbers by nodes indicate the corresponding range of percent Bootstrap Support (BS; top) for Maximum likelihood; and Posterior Probabilities (PP; bottom) for Bayesian inference methods (clade support values for each analysis are shown in Table S4). Nodes receiving 100% for all methods are denoted with an *. NS: less than 50% node support. Samples examined by Taiti et al. [19] are marked with †.

