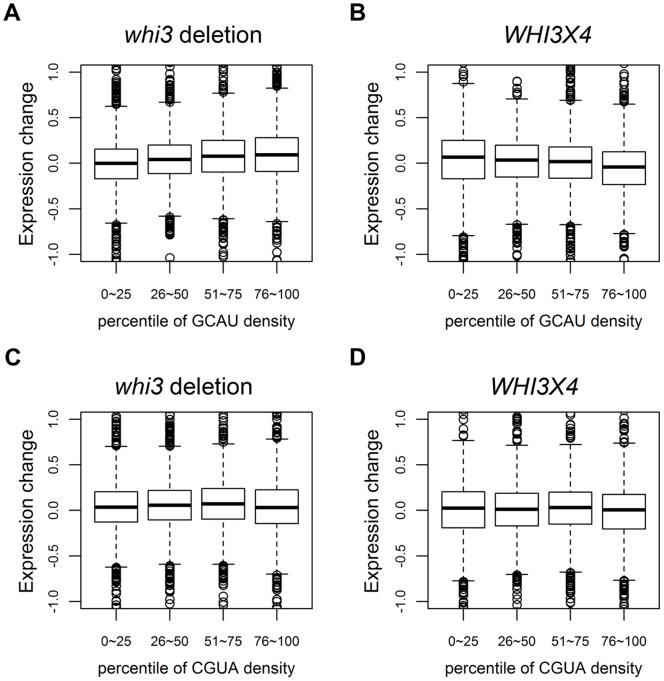
Figure 1. mRNAs rich in GCAUs have increased abundance in whi3 mutants by microarray.
Genes were divided into quartiles according to their GCAU density (Materials and methods). For each quartile, change in mRNA abundance is shown in (A) whi3 mutants relative to wild-type; (B), WHI3 over-expressors relative to wild-type. As a control, genes were divided into quartiles according to their CGUA density (an irrelevant control motif). For each quartile, change in mRNA abundance is shown in (C) whi3 mutants relative to wild-type; and (D) WHI3 over-expressors relative to wild-type. Changes are shown as the log2 of the ratio of abundance in whi3 divided by abundance in WT (A, C) or the ratio of abundance in WHI3X4 divided by abundance in WT (B, D).

