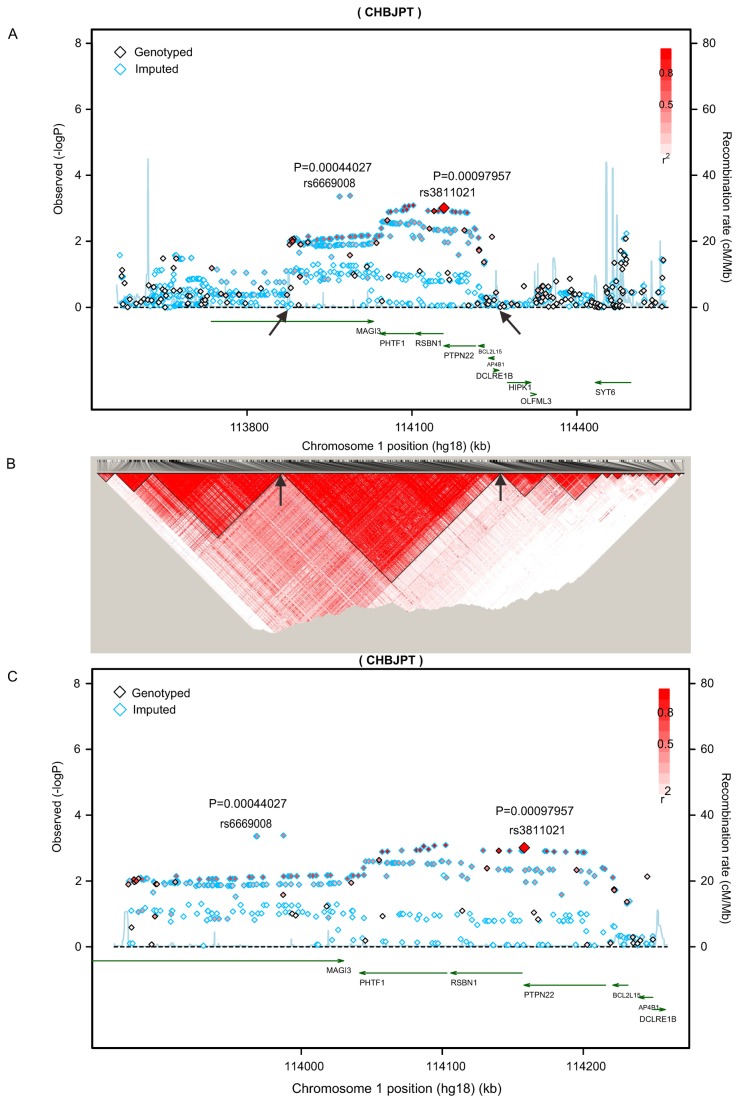
Figure 1. Regional plot of association results in LD block containing PTPN22 at 1p13.2 in GWAS stage.
(A) The results of association for 1,277 genotyped and imputed SNPs in the 1.2-Mb region containing PTPN22 with Graves’ disease. The color of each SNP spot reflects its r2, with the top typed SNP (large red diamond) within each association locus changing from red to white. Genetic recombination rates, estimated using the 1000 Genomes pilot 1 CHB and JPT samples, are shown in cyan. Physical positions are based on NCBI build 36. (B) Linkage disequilibrium plots of the 1,277 SNPs in the 1.2-Mb region containing PTPN22. The r2 value is estimated by the genotype data of GD cases and controls enrolled in the GWAS. We constructed the plots using Haploview software version 4.2. (C) The plots of the association of 474 genotyped and imputed SNPs with GD. These 474 SNPs are located in a ~445-kb linkage disequilibrium region containing PTPN22 and were marked with arrows in panels A and B.

