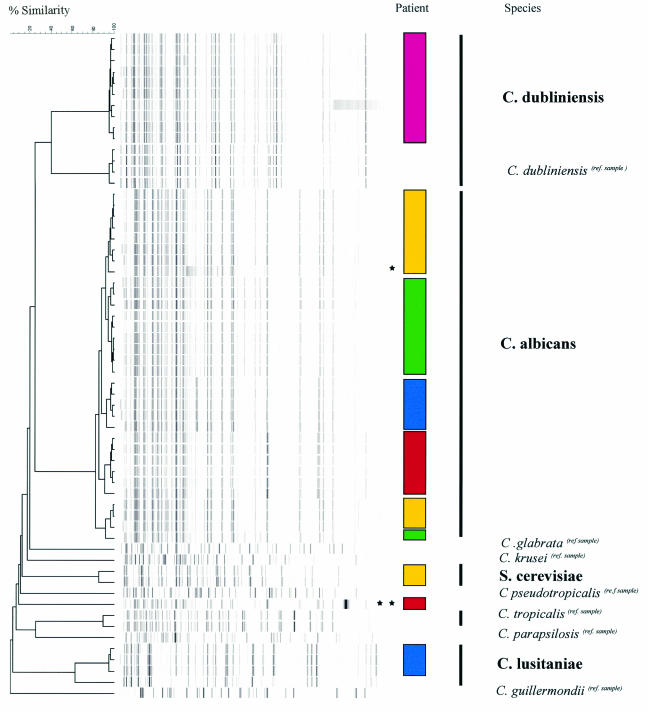
FIG. 1.
Dendrogram obtained by AFLP analysis. Patients are coded by color blocks, as follows: patient 449, green; patient 501, yellow; patient 502, blue; patient 503, pink; and patient 505, red. The AFLP dendrogram clearly shows the clustering of bands for each species and strain that can be identified as specific for individual patients (in boldface) and identified by matching to a reference strain (ref. sample). The isolates from no two patients had identical patterns, clearly illustrating that nosocomial spread was not evident in the study population. DNA variations were seen within individual patient isolates, although the sequences of these isolates were mostly 90 to 95% similar to that of the original isolate, which is indicative of homology. *, one of the minimal additional bands associated with a fluconazole-resistant C. albicans isolate (patient 501); **, DNA variation, with the sequence of the isolate being <90% similar to that of the original C. albicans isolate from this patient (patient 505), suggestive of microevolution unrelated to the administration of antimicrobials.

