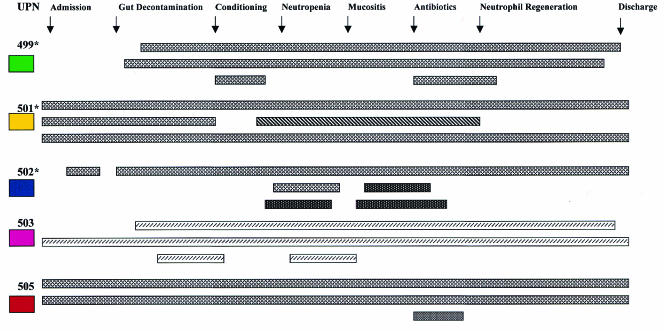
FIG. 2.
Diagrammatic representation of the isolates obtained from various sites over time in relation to the occurrence of specific transplant events. The source of each isolate is (from top to bottom for each patient) throat, fecal, and perineal swab specimen cultures (specimens were obtained two times weekly). The color codes for the patients are as described in the legend to Fig. 1. *, patients who received treatment with oral fluconazole. The yeasts are represented as follows: C. albicans, ▩ and ; S. cerevisiae, ▧; C. lusitaniae, ; C. dubliniensis, ▨. UPN, patient number.

