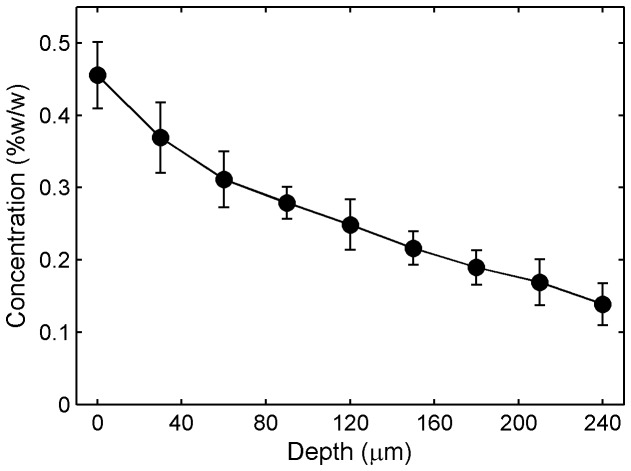
Figure 11. Tenofovir concentration vs.
depth in tissue in the
Transwell assay.
Confocal Raman scans were performed on tissue specimens that had been incubated under a fluid layer (containing 1% Tenofovir) in the Transwell assay for 6 h (Figure 10). After baseline correction, the intensity of the Tenofovir Raman band was normalized with respect to the intensity of the tissue band at 643 cm-1. Normalized intensities were background-subtracted and fitted into a respective calibration curve of Tenofovir in tissue homogenate to deduce the concentration vs. depth profiles. The Raman measurements showed a decline in concentration as the depth into the tissue increased. Data shown give mean ± standard error of the mean (n=7).

