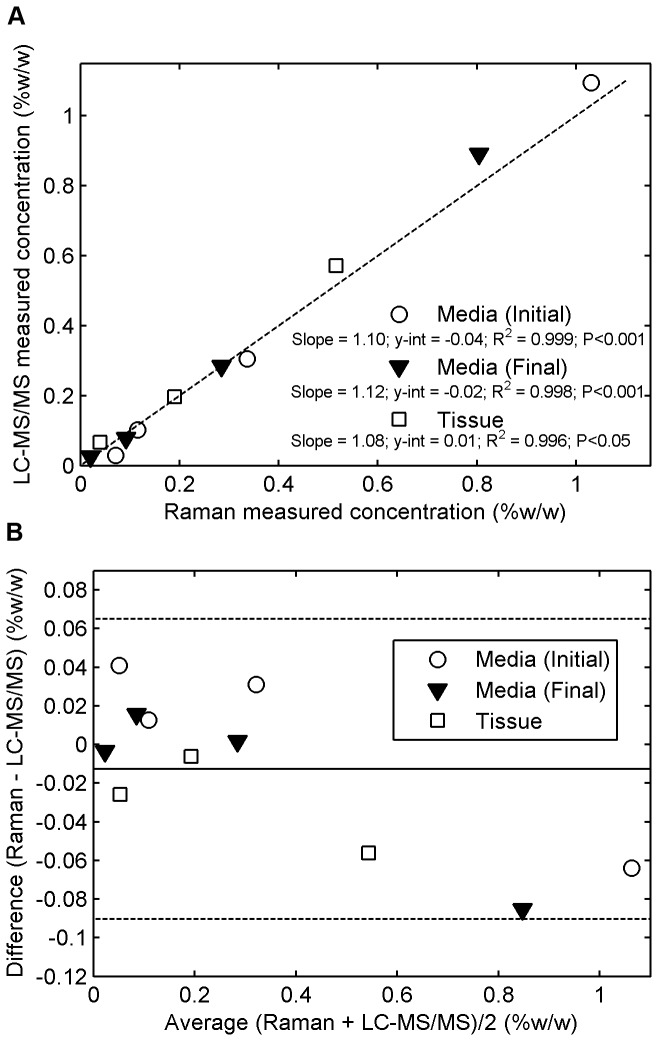
Figure 13. Agreement of Raman measurements of Tenofovir Concentration (Horiba instrument) with gold-standard.
measurements by LC-MS/MS.
Serial dilutions of Tenofovir in Ringer's solution were equilibrated with freshly excised tissue specimens for 24 h at 4 °C. The Tenofovir concentration in fluid before (initial) and after (final) incubation, and the final concentration in tissue, were evaluated by both techniques: (a) the correlations between Tenofovir concentration values in fluid and tissue obtained from the Raman spectroscopic method vs. those derived from the validated LC-MS/MS technique. The dashed line indicates a straight 45-degree line (y=x) passing through the origin of the axes. (b) Bland-Altman analysis for determining the levels of agreement between the two measurement methods of Tenofovir concentrations in fluid and tissue. This gives absolute differences between the two measurement methods in relation to their average values. Solid lines represent mean differences, and dashed lines indicate the 95% confidence intervals.

