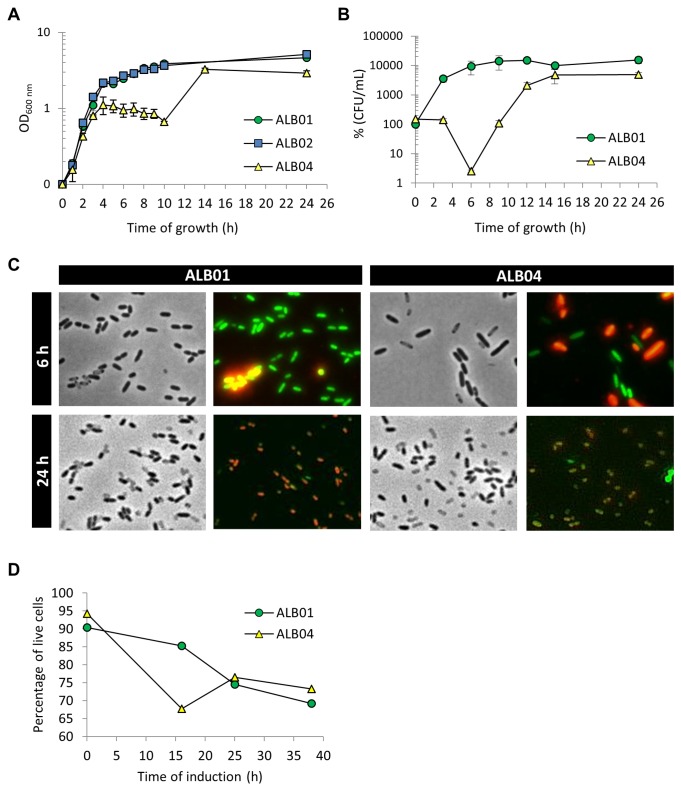
Figure 2. SigX overexpression alters growth and morphology of P. aeruginosa.
A. Growth curve of sigX overexpressing strain (ALB04) and control (ALB01) in LB with 50 mg/mL gentamycin and 0.2% of arabinose at 37°C and 240 rpm. B. Survival was measured by counting colony forming units (CFU) along the growth curve. C. Phase contrast and fluorescence microscopy. In both panels, the column on the left shows the cells as seen in phase contrast microscopy, while the column on the right depicts fluorescence microscopy of the cultures previously stained with LIVE/DEAD BacLight Bacterial Viability Kit (Invitrogen), where membrane damaged cells (dead) are colored in red. All pictures are at the same scale. D. Flow cytometry analysis of LIVE/DEAD stained cells. The values plotted in A and B are means of three biological replicates and error bars represent standard deviation. Flow cytometry was carried out with biological duplicates in two different occasions and values shown are representative of one experiment.

