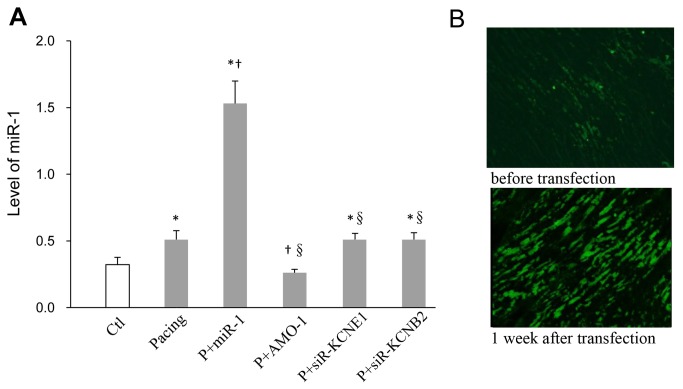
Figure 1. miR-1 expression.
QRT-PCR quantification of miR-1 in each group (A). Immunofluorescence analysis of atrial samples from the rabbit model of right A-TP obtained 1-week after LVs infection with miR-1-LVs (B). * P < 0.05 vs. Ctl, † P < 0.05 vs. Pacing, §P < 0.05 vs. P+miR-1, one-way ANOVA and Tukey’s post-hoc test; n = 6 independent RNA samples for each group.

