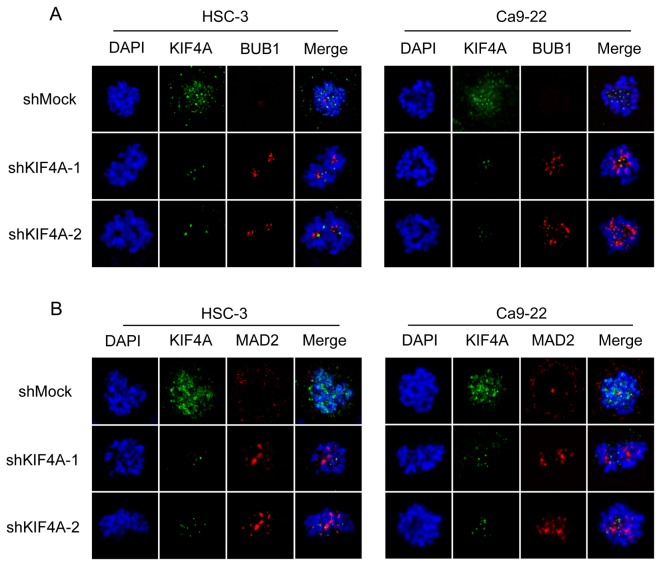
Figure 3. Localization of BUB1 and MAD2 during the prometaphase in shMock and shKIF4A cells.
Localization of BUB1 and MAD2 to the kinetochores is compared in shKIF4A and shMock cells by immunofluorescence. (A) BUB1 on kinetochores increased in shKIF4A cells compared with that in the shMock cells (green, KIF4A; red, BUB1; blue, DNA). (B) Appropriate localization of MAD2 is seen in shKIF4A cells, whereas kinetochore localization is not seen in the shMock cells (green, KIF4A; red, MAD2; blue, DNA).

