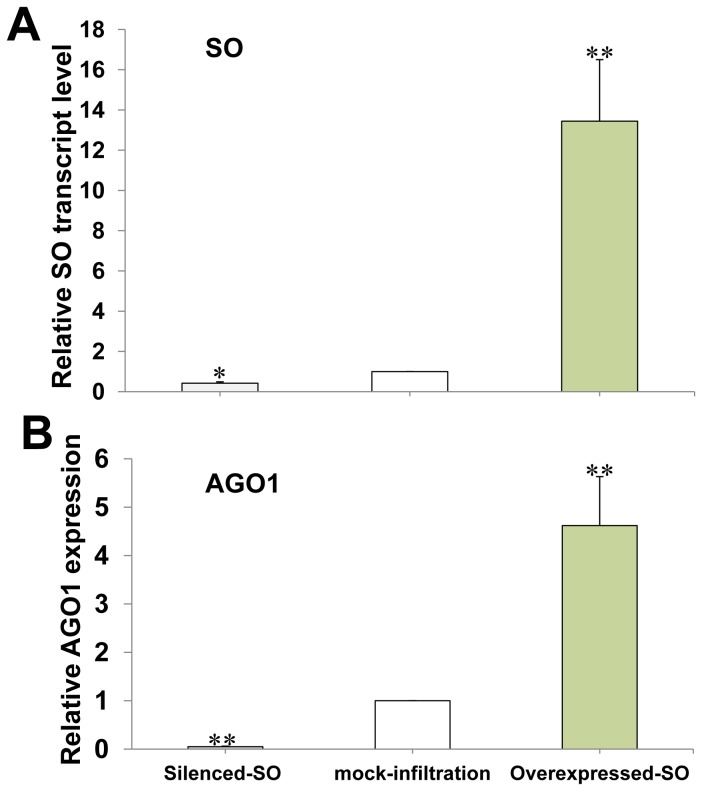
Figure 5. Upregulation of AGO1 after SO overexpression.
(A) Relative SO gene transcript level was used to test the SO gene overexpression and silencing efficiency. (B) Upregulation or downregulation of AGO1 gene transcript after SO overexpression or silencing. Actin gene was used as internal control. The relative gene expression amount was analyzed using the 2-∆∆C T method. Significant differences among silenced-SO, mock-infiltration and overexpressed-SO were calculated using the one sample Student’s t-test analysis. Asterisks (* and **) indicate significance at 0.05 and 0.01 levels of confidence, respectively.

