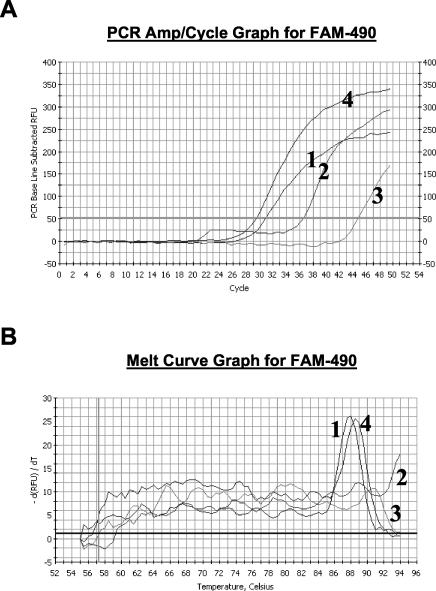
FIG. 4.
(A) Amplification profiles of real-time PCR with SYBR Green I. Curves 1 and 2, amplification profile for a representative prn1 strain with primer pairs QJF3-QJR1 and QJF4-QJR1, respectively; curves 3 and 4, amplification profile for a representative prn7 strain with primer pairs QJF3-QJR1 and QJF4-QJR1, respectively. (B) Melting curves from the specific amplification assays shown in panel A.

