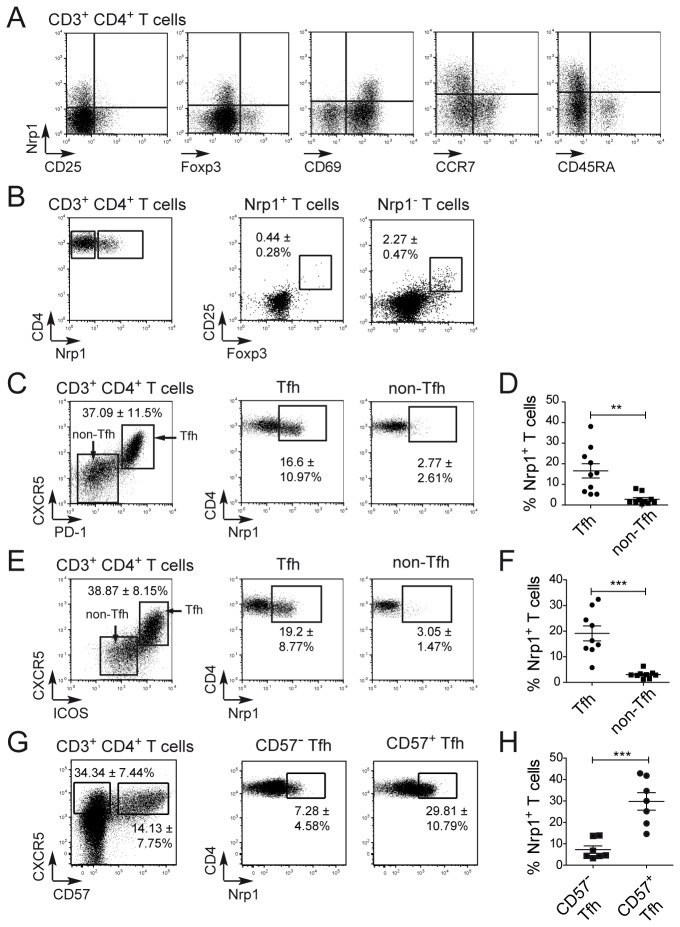
Figure 1. Tonsillar Nrp1+ CD4+ T cells have a Tfh phenotype in vivo.
(A) Representative flow cytometry analysis of Nrp1 and CD25, Foxp3, CD69, CCR7 and CD45RA co-expression on tonsillar CD3+ CD4+ T cells population. (B) CD25 and Foxp3 co-expression on tonsillar CD3+ CD4+ Nrp1+ and Nrp1- T cell populations. (C-F) Nrp1 expression on tonsillar Tfh cells and non-Tfh cells, defined as CD3+ CD4+ CXCR5+ PD-1+ and CD3+ CD4+ CXCR5- PD-1- respectively (C-D), or CD3+ CD4+ CXCR5+ ICOShi and CD3+ CD4+ CXCR5- ICOSlo respectively (E-F). Numbers in flow cytometry plots indicate the mean percentage ± SD of Tfh cells in CD4+ T cells (left) and of Nrp1+ cells in Tfh cells (middle) and non-Tfh cells (right) (n=10 tonsils). (G-H) Nrp1 expression on tonsillar CD3+ CD4+ CXCR5+ CD57+ and CD3+ CD4+ CXCR5- CD57- Tfh cells. Data were compared using Student’s impaired t-test (**: p≤0.01, ***: p≤0.001).

