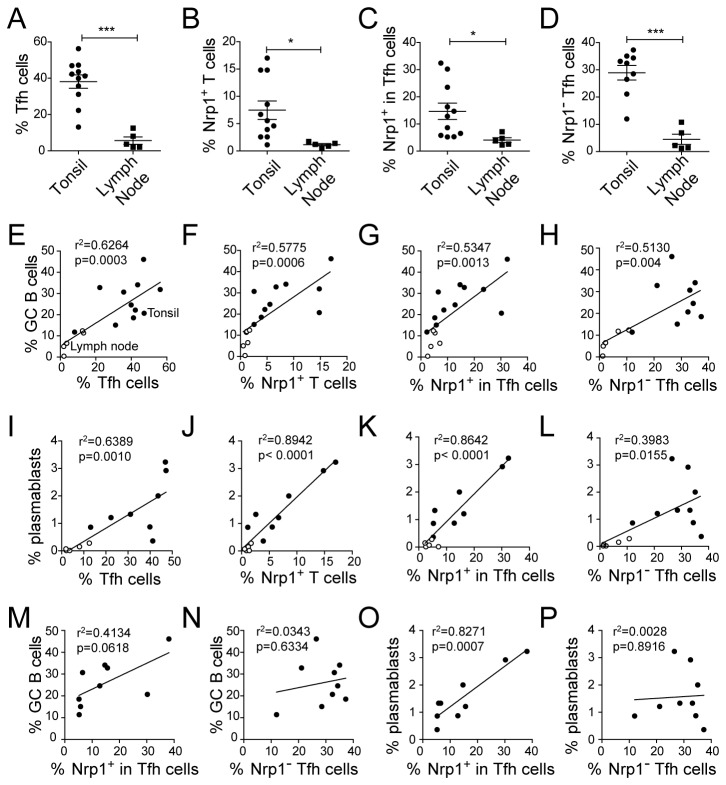
Figure 4. Correlation between Nrp1 expression and germinal center activity in secondary lymphoid organs.
Tonsils and non-malignant reactive lymph nodes were compared for their percentages of Tfh cells (A), Nrp1+ T cells (B) and Nrp1- Tfh cells (D) in CD4+ T cells and for their percentage of Nrp1+ cells in Tfh cells (C) . (E-L) Correlation between the percentage of Tfh cells (E and I), Nrp1+ T cells (F and J), Nrp1+ cells in Tfh cells (G and K), and Nrp1- Tfh cells (H and L) and the percentage of GC B cells (E-H) or plasmablasts (I-L) among CD19+ cells in tonsils (full circle) and non-malignant reactive lymph nodes (white circle). (M-P) Correlation between the percentage of Nrp1+ cells in Tfh cells (M and O), or the percentage of Nrp1- Tfh cells (N and P), and the percentage of GC B cells (M-N) or plasmablasts (O-P) among CD19+ cells only in tonsils only. Data were compared using Student’s impaired t-test (*: p≤0.05, ***: p≤0.001) (A-D). For correlation analyses, the correlation coefficient r2 and the associated p-value are shown.

