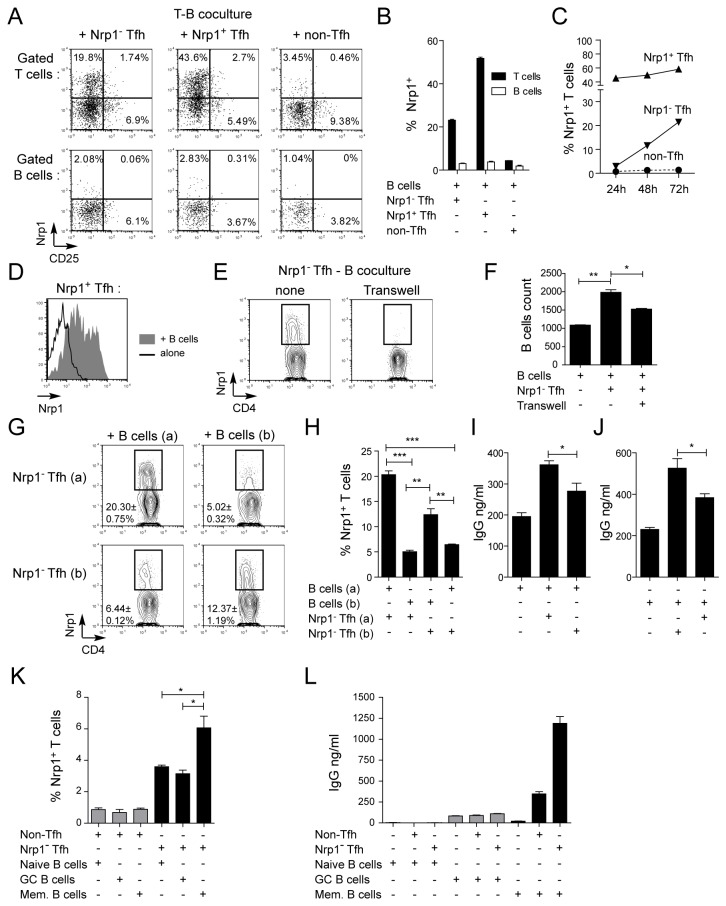
Figure 5. Nrp1 expression by Tfh cells requires cognate B cell contact and reflects Tfh activity in vitro.
(A-C) Nrp1- Tfh, Nrp1+ Tfh and non-Tfh cells were sorted as in Figure 1 and cultured with autologous B cells in the absence of exogenous stimuli. (A) Representative expression of CD25 and Nrp1 on T cells (top) and B cells (bottom) after 5 days of culture. (B) Percentage of Nrp1+ cells among T or B cells after 5 days of culture. (C) Percentage of Nrp1+ cells among T cells after 24, 48 and 72 hours of culture. In B and C, representative data from one out of three distinct experiments are shown. (D) Nrp1 expression on sorted Nrp1+ Tfh cells after 5 days of culture alone (dark line) or with autologous B cells (shaded histogram). (E-F) Nrp1- Tfh cells were cultured with autologous B cells in the absence or presence of a transwell membrane separating the two cell types. (E) Representative Nrp1 expression on T cells after 5 days of culture. (F) Number of live B cells per well after 5 days of culture. (G-J) Autologous or allogeneic cocultures were performed using Nrp1- Tfh and B cells sorted from two distinct tonsils (a) and (b). (G) Nrp1 expression on T cells after 5 days of culture. Data represent one experiment with triplicate wells and are representative of three distinct experiments. (I-J) IgG production in culture supernatant after 10 days of culture. (K-L) Sorted naive, GC or memory B cells were cultured in the absence or presence of autologous CXCR5- Nrp1- non-Tfh cells or CXCR5+ Nrp1- Tfh cells. (K) Nrp1 expression on non-Tfh cells and Nrp1- Tfh cells after 4 days of culture. (L) IgG production in culture supernatants after 14 days of culture. Data were compared using Student’s impaired t-test (*: p≤0.05, **: p≤0.01).

