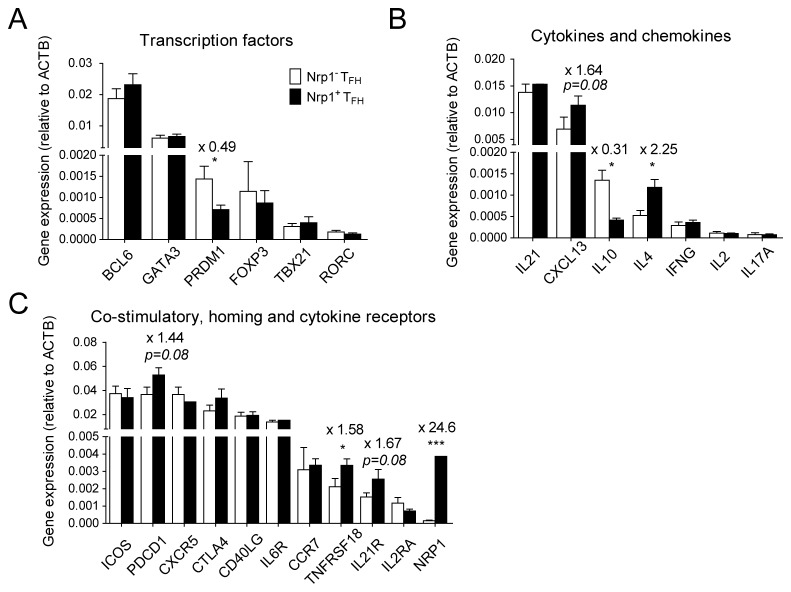
Figure 6. Gene expression profiles of Nrp1- and Nrp1+ Tfh cells.
Nrp1- and Nrp1+ Tfh cells were sorted from 5 distinct tonsils and analyzed for gene expression as described in Materials and Methods. Gene expression (normalized to ACTB) of a selection of relevant transcription factors (A), cytokines and chemokines (B), co-stimulatory, homing and cytokine receptors (C) in Nrp1- and Nrp1+ Tfh cells is shown here. Numbers above bars indicate fold change and p-value (paired student’s t test).

