
Figure 4.
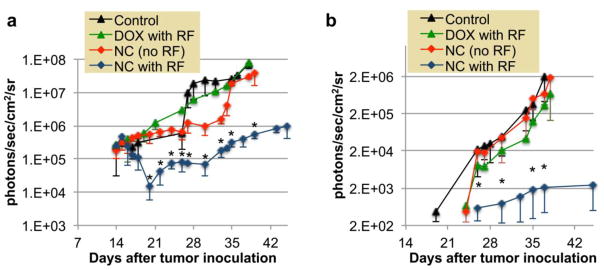
Overall comparison of the BLI signal indicating the progression of (a) the primary and (b) metastatic spread of the untreated group (control), DOX-treated group (DOX with RF), the nanochain-treated group (NC-no RF), and the nanochain-treated group followed by RF (NC with RF). Y-axis is in logarithmic scale. Data points marked with asterisks are statistically different between the “NC with RF” group and the other groups. Data points marked with crosses are statistically different between the “NC(no RF)” group and the control group (* and † P<0.05; n=5–6 animals per group).