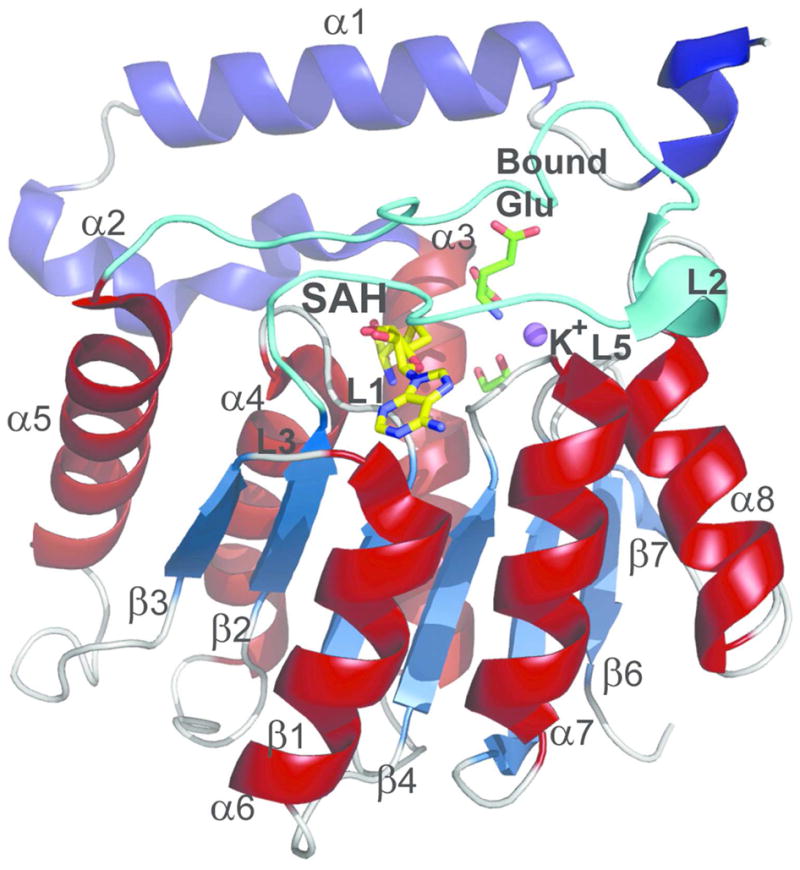
Figure 4.

CalS11 monomer with secondary structural elements labeled. The N-terminal helices are colored blue and the helices from the core MT Rossmann fold are colored brick-red. The dynamic loop L2 is colored in cyan. SAH, bound glutamate and ethylene glycol are represented by stick models and are colored yellow and green, respectively. K+ ion is represented as a purple sphere.
