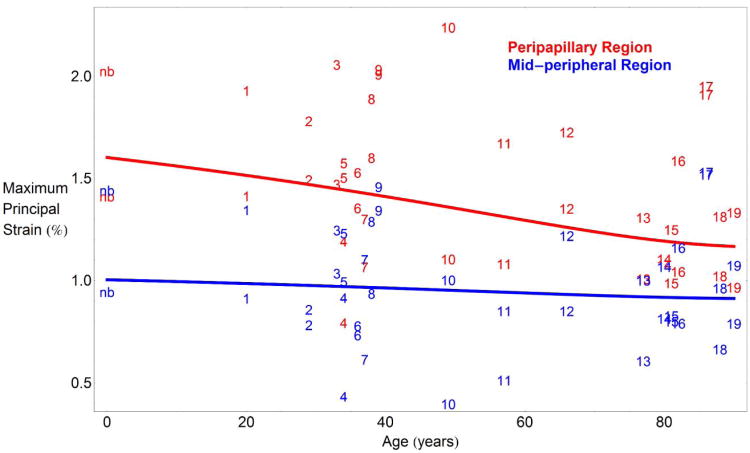
Fig. 3.
Average regional maximum principal strain versus age for a pressure elevation of 40 mmHg. Overall regional mean maximum principal strain in the peripapillary region significantly decreases with age (P<0.001), while mid-peripheral strain did not exhibit a significant change with age (P=0.16). Maximum principal (tensile) strain was significantly higher in the peripapillary region (red line) than in the mid-peripheral region (blue line) at all ages (P<0.001). Mean maximum principal strain values for the peripapillary (red numbers) and mid-peripheral (blue numbers) regions of each eye are labeled by donor number, which were assigned in ascending order by donor age (higher numbers indicate higher age). Strain data from the newborn donor (nb) is included in the plot but not in the statistical analysis used to estimate the plotted curves, and it matches the statistical estimates of scleral strain at age 0 years

