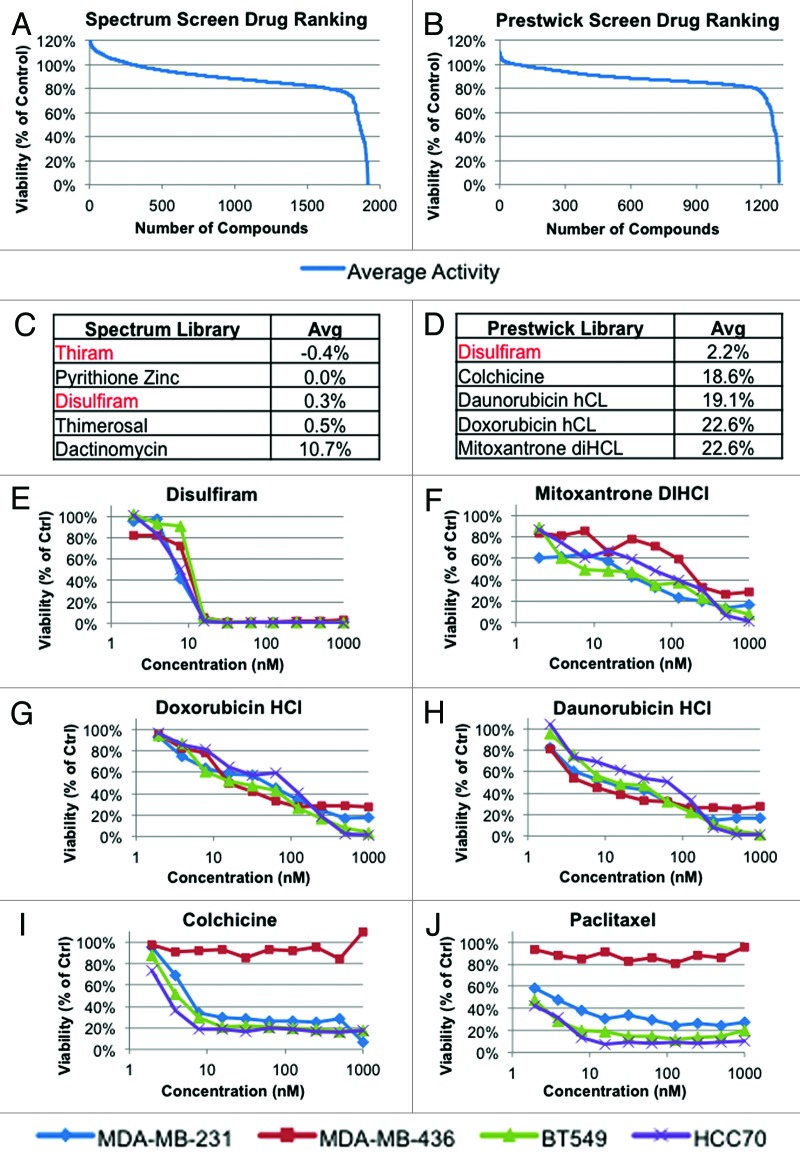
Figure 1. High-throughput screen of 3185 compounds with known biological activities against 4 human-derived TNBC cell lines (MDA-MB-231, MDA-MB-436, HCC70, Bt549). Shown are the average responses by the 4 lines to (A) Spectrum library (1 µM, 2000 drugs), (B) Prestwick library (0.8 µM, 1185 drugs). (C and D) Top 5 hits from the Spectrum and Prestwick libraries; disulfiram and thiram are highlighted in red. Values represent the average cell viability of all 4 lines expressed as a percentage of vehicle treated control. (E–J) Validation and dose-response curves for select hits using alamar blue viability assay, performed in triplicate.

An official website of the United States government
Here's how you know
Official websites use .gov
A
.gov website belongs to an official
government organization in the United States.
Secure .gov websites use HTTPS
A lock (
) or https:// means you've safely
connected to the .gov website. Share sensitive
information only on official, secure websites.
