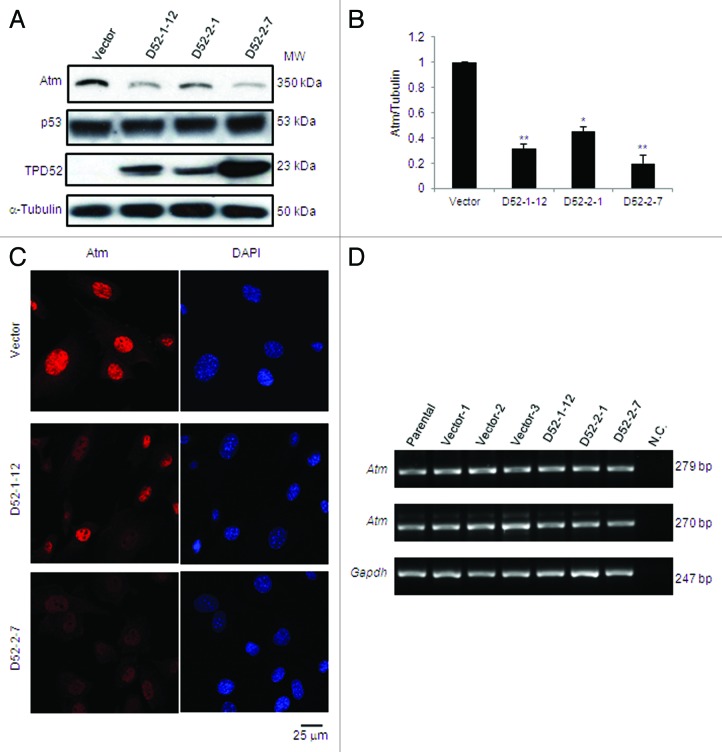
Figure 4. Stable TPD52 expression decreased Atm protein but not transcript levels in mouse 3T3 cells. (A) Western blot analyses of vector- and TPD52-transfected 3T3 cell lines with antisera to the proteins shown (left). α-Tubulin served as a loading control. Results are representative of 3 independent experiments. (B) Densitometry analyses of western blots obtained in (A). Mean ± SD of Atm levels relative to α-tubulin are plotted on Y-axis with vector control set as 1. **P = 0.0060 (D52-1-12); P = 0.0033 (D52-2-7); *P = 0.0159 (D52-2-1); Student t test. (C) Immunofluorescence analyses of endogenous Atm (left). Nuclei were counterstained using DAPI (right). Scale bar = 25 μm. (D) Total RNA from 3T3 cells (parental), 3 vector control (Vector-1, Vector-2, Vector-3) and 3 TPD52-expressing cell lines (D52-1-12, D52-2-1, D52-2-7) was subjected to cDNA synthesis and RT-PCR to amplify Atm products 279 bp or 270 bp. Gapdh was amplified as a control gene. N.C., negative control in which cDNA was replaced by water.

An official website of the United States government
Here's how you know
Official websites use .gov
A
.gov website belongs to an official
government organization in the United States.
Secure .gov websites use HTTPS
A lock (
) or https:// means you've safely
connected to the .gov website. Share sensitive
information only on official, secure websites.
