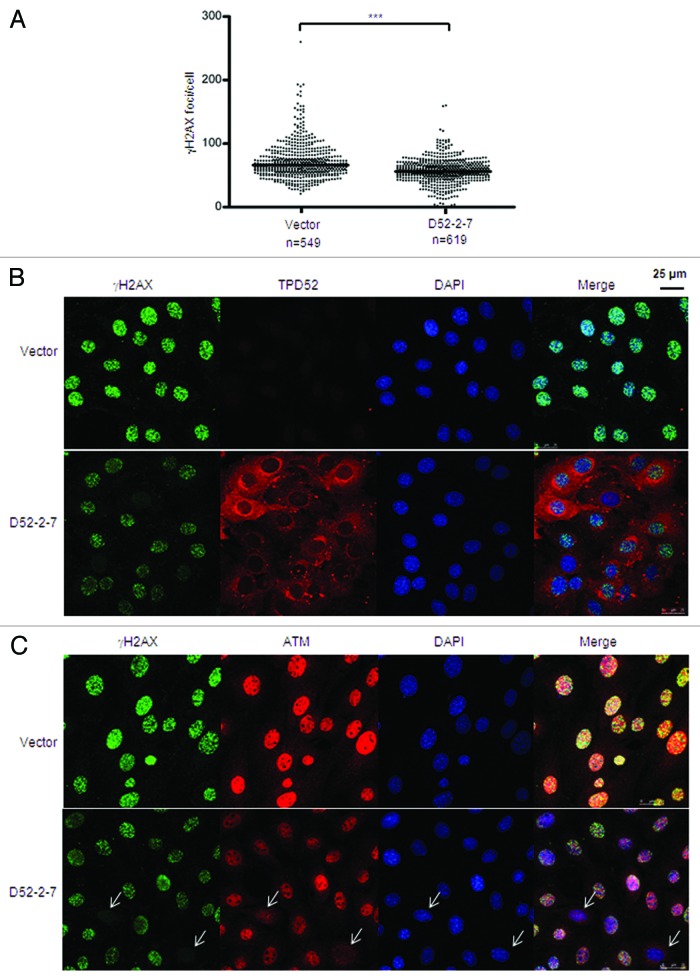
Figure 5. Stable TPD52 expression disrupted γH2AX focus formation post-IR. Vector and D52-2-7 cells were treated with 2 Gy IR, fixed after 30 min and subjected to immunofluorescence analyses. (A) γH2AX foci were visualized using immunofluorescence and quantitated using Metamorph. Scatter plots of the numbers of γH2AX foci/cell from 3 independent experiments obtained as described in Figure 3. ***P < 0.0001 (n = 1168; Mann–Whitney U test). (B) Co-staining of γH2AX and TPD52, or (C) γH2AX and Atm, with nuclei counterstained using DAPI. Arrows highlight cells lacking nuclear Atm staining and γH2AX focus formation. Scale bar = 25 μm.

An official website of the United States government
Here's how you know
Official websites use .gov
A
.gov website belongs to an official
government organization in the United States.
Secure .gov websites use HTTPS
A lock (
) or https:// means you've safely
connected to the .gov website. Share sensitive
information only on official, secure websites.
