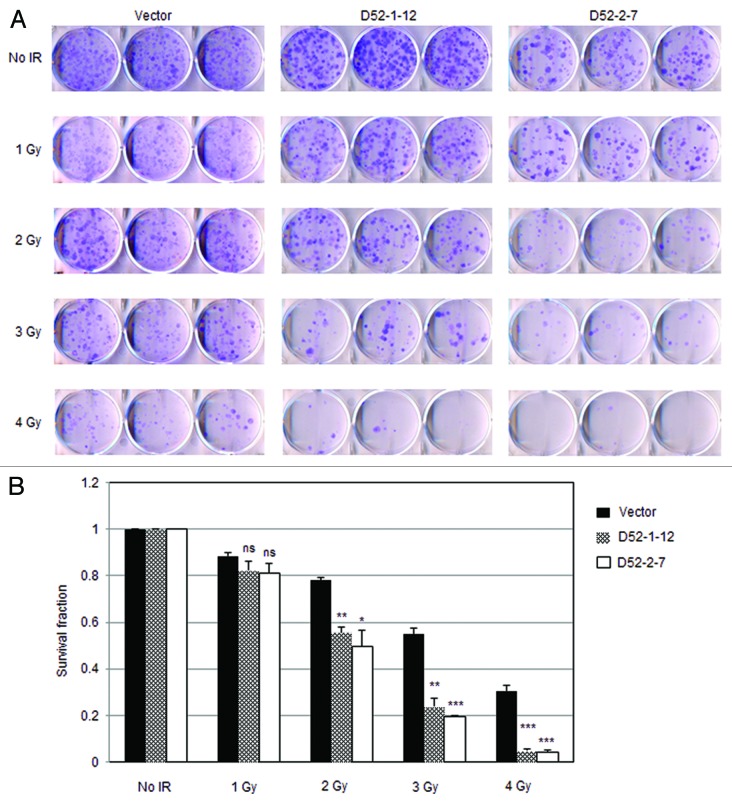
Figure 6. Stable TPD52 expression sensitized cells to γ-ray irradiation. (A) 3T3 vector cell line and 2 TPD52-expressing cell lines (D52-1-12, D52-2-7) were untreated or exposed to the indicated doses of IR, and clonogenic survival assays were then performed. Images shown are representative of those obtained from 3 independent experiments. (B) Colonies with > 50 cells/ colony were counted and mean ± SE of survival fraction for each dose per cell line plotted on the Y-axis, with no treatment control set as 1. Vector v. D52-1-12: ns (not significant, 1 Gy); P = 0.0012 (2 Gy); P = 0.0015 (3 Gy); P = 0.0006 (4 Gy). Vector v. D52-2-7: ns (1 Gy); P = 0.0183 (2 Gy); P = 0.0002 (3 Gy); P = 0.0007 (4 Gy), Student t test.

An official website of the United States government
Here's how you know
Official websites use .gov
A
.gov website belongs to an official
government organization in the United States.
Secure .gov websites use HTTPS
A lock (
) or https:// means you've safely
connected to the .gov website. Share sensitive
information only on official, secure websites.
