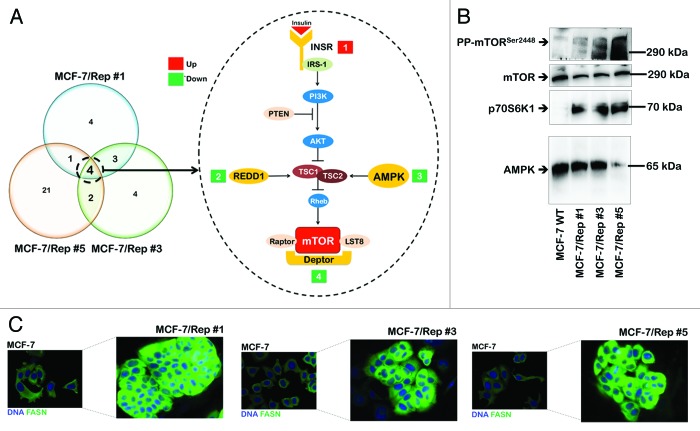
Figure 6. Activation of the mTOR pathway in Sox2-overexpressing CSC-like cellular states. (A) Overlaps between differentially expressed mTOR signaling-related genes in three MCF-7/Rep clonal groups. Venn diagram showing common changes in gene expression between three clonal groups (groups #1, #3, and #5) of MCF-7/Rep cells vs. parental MCF-7 cells. These Venn diagrams illustrate the overlaps between genes that were scored as being either up- or downregulated (n = 3 replicates for each clone). To be included as an overlap, a gene must be differentially expressed in at least one time point in both time courses (>3.0-fold and P value < / = 0.05). The 4 genes commonly regulated in the 3 MCF-7/Rep clonal groups are depicted on the left. Genes that are positively regulated over time (red), and genes that are negatively regulated over time (green) are indicated. The P value for the 3 clonal groups was calculated using a hypergeometric test and indicates that the probability of identifying the overlapping genes by random chance is very low. (B) Representative immunoblotting analyses of total AMPK, total p70S6K1, total mTOR, and phospho-mTORSer2448 in MCF-7 parental cells and MCF-7/Rep clones. The protein extracted from the harvested cells was resolved by SDS-PAGE, transferred to nitrocellulose membranes, and probed with the indicated antibodies. (C) Activation of the lipogenic phenotype in MCF-7/Rep cells. Robust expression of the lipogenic enzyme fatty acid synthase (FASN) in MCF-7/Rep cells as measured by immunofluorescence microscopy. Note that MCF-7/Rep cells express drastically higher levels of FASN than parental MCF-7 cells.

An official website of the United States government
Here's how you know
Official websites use .gov
A
.gov website belongs to an official
government organization in the United States.
Secure .gov websites use HTTPS
A lock (
) or https:// means you've safely
connected to the .gov website. Share sensitive
information only on official, secure websites.
