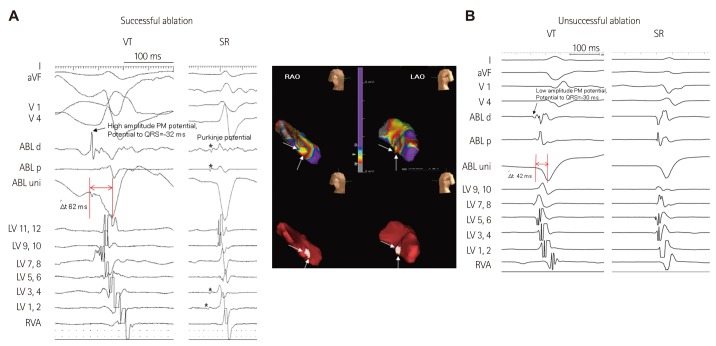
Fig. 3.
Local bipolar electrogram, unipolar electrogram and three-dimensional electroanatomic mapping images of successful (A) and unsuccessful (B) ablation sites of VT originating from the PPM in the LV. A: a high-amplitude discrete potential (arrow) from the distal bipole of the ablation catheter was recorded during VT (left panel) and Purkinje potential (asterisk) during sinus rhythm (middle panel) at the site of successful ablation. A relatively slow downstroke of initial Q wave on unipolar electrogram was observed. The duration from onset to peak downstroke was 62 ms. The three-dimensional electroanatomical mapping (right panel) obtained during procedure in the right and left anterior oblique view showed the color-coded voltage map (right upper panel) and successful ablation site (right lower panel) of the PPM in the LV. White dots represent the site of RFCA. White arrows indicate the PPM area in the LV. B: a low-amplitude myocardial potential (arrow) recorded during VT from the distal bipole of the ablation catheter preceded the onset of QRS by 34 ms. A relatively steep downstroke of initial Q wave on unipolar electrogram was observed at the unsuccessful ablation site (left panel). The duration from onset to peak downstroke was 42 ms. No Purkinje potential was shown during sinus rhythm (right panel). ABL: ablation catheter, LAO: left anterior oblique view, LV: left ventricle, PPM: posterior papillary muscle, RAO: right anterior oblique view, RVA: right ventricular apex, SR: sinus rhythm, VT: ventricular tachycardia, RFCA: radiofrequency catheter ablation, Δt: the time from the initial QS wave onset to the initial QS wave peak on unipolar electrogram.

