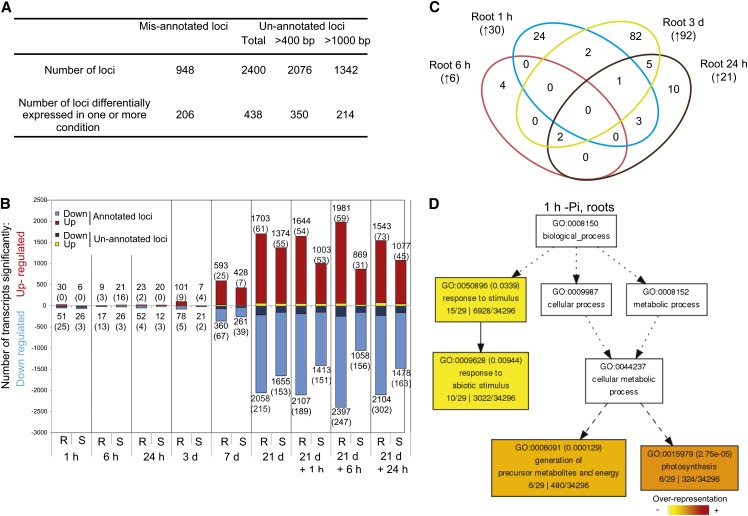
Figure 2.
Profiling the Transcriptome Response to Pi Stress Using RNAseq.
(A) Summary of the reference annotation–based transcript assembly and the corresponding mis- and unannotated loci identified.
(B) Number of significantly differentially expressed genes after varying length of Pi deprivation in roots (R) and shoots (S) using Cufflinks (P < 0.05, FDR < 0.05). Number in parenthesis represents the number of previously unannotated loci among the differentially expressed genes.
(C) Venn diagram representing the overlap of the early molecular responses in the roots upon Pi deprivation (1 h to 3 d). Number in parenthesis represents the number of genes upregulated by Pi deprivation.
(D) AgriGO representation of the overrepresented GO terms in the 30 genes upregulated by 1 h of Pi deprivation in the roots was generated using singular analysis enrichment (Fisher’s test, P < 0.05, FDR < 0.05). Number in parenthesis represents the FDR value.

