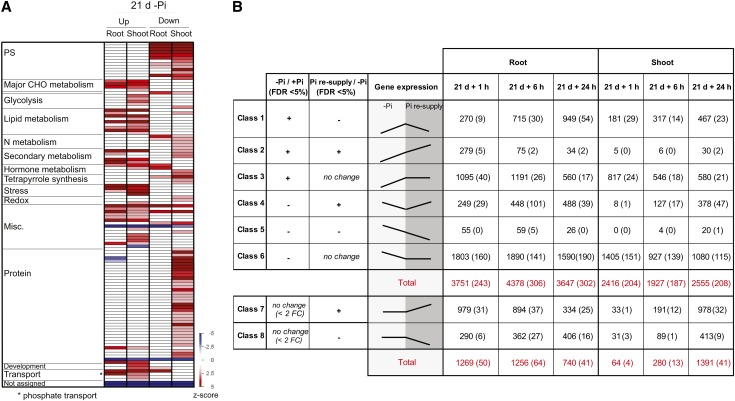
Figure 3.
Profiling the Long-Term Responses to Pi Starvation and Pi Recovery Using RNAseq.
(A) PAGEMAN analysis showing significant over- and underrepresented functional categories in the roots and shoots after 21 d of Pi starvation. Fisher’s exact test was used to determine overrepresented functional categories, and scores are displayed as a heat map, where a z-score of 1.96 represents a P value of 0.05. PS, photosynthesis.
(B) Classification of the differentially regulated genes based on their expression pattern in response to Pi starvation and resupply and the corresponding number of genes present in each class (P < 0.05, FDR < 0.05). Number in parenthesis represents the number of previously unannotated loci among the differentially expressed genes. FC, fold change.

