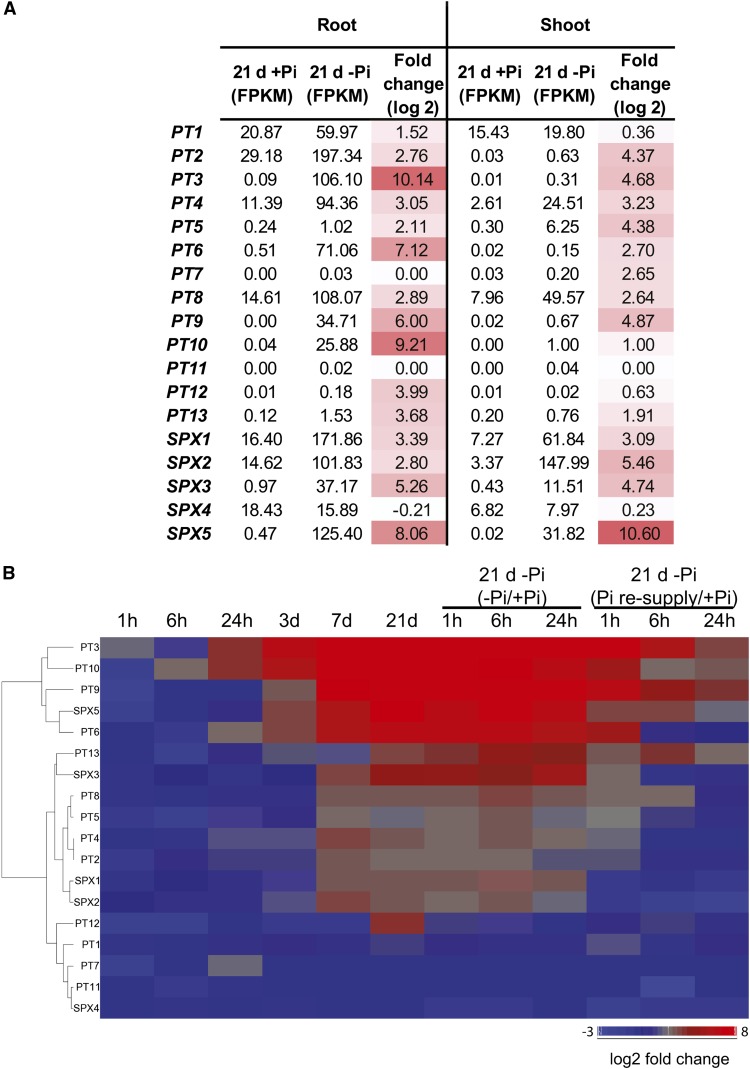
Figure 6.
Expression Patterns of the High-Affinity Pi Transporters and SPX Genes.
(A) Schematic representation of the expression levels and fold changes of the high-affinity Pi transporters (PTs) and the SPX genes in response to 21 d of Pi starvation in roots and shoots.
(B) Hierarchical clustering of the expression levels of the SPX and PTs genes in response to Pi starvation and resupply in the roots.

