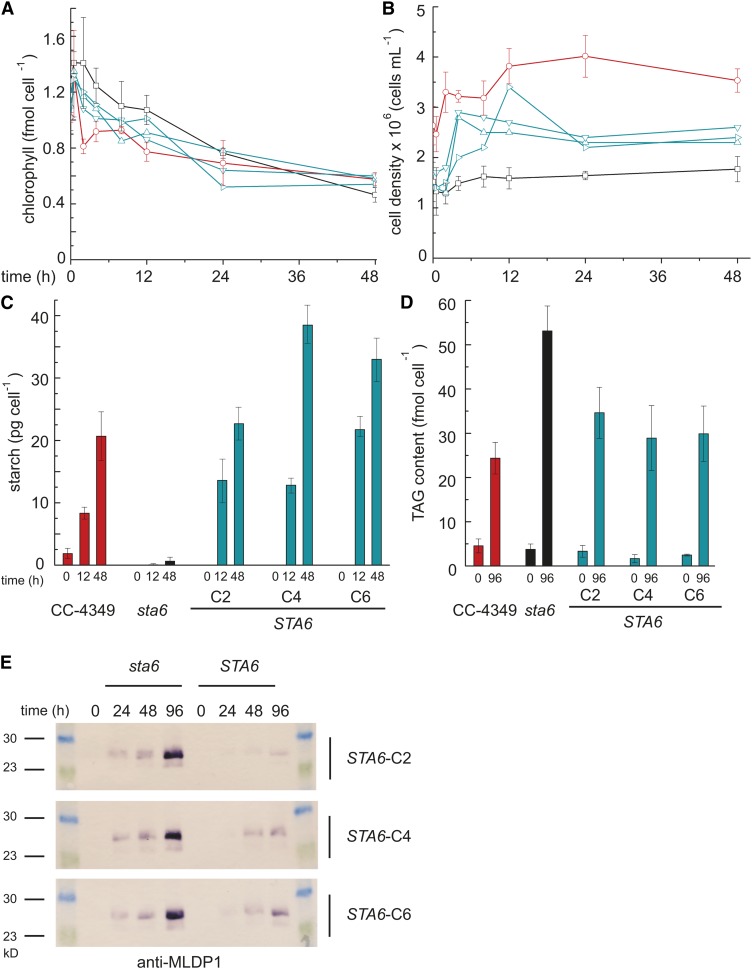
Figure 1.
Increased TAG but Not Starch in the sta6 Mutant.
In all panels, CC-4349 is shown in red, sta6 (CC-4348) in black, and three strains complemented for STA6 (STA6-C2, STA6-C4, and STA6-C6) in blue. Chlorophyll content (A), cell density (B), starch content per cell (C), and TAG per cell (D). Error bars represent one sd calculated from three separate cultures (biological replicates). (E) shows an immunoblot of MLDP1 using protein extracts obtained from N-deprived cultures of sta6 and STA6-C2, STA6-C4, and STA6-C6, sampled at 0, 24, 48, and 96 h as indicated.

