
Figure 2.
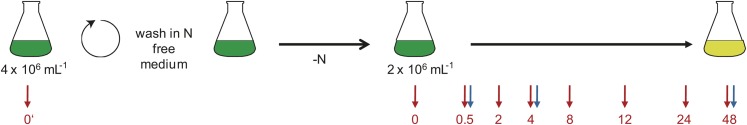
Experimental Design for Sampling the Transcriptome.
Cultures were grown to a density of 4 × 10⁶ cells mL−1 in +N medium and washed in N-free medium before resuspending cells to a final density of 2 × 10⁶ cells mL−1 in N-free medium. For the time-course experiment comparing CC-4349 and sta6, samples were taken in triplicate at 0’ (i.e., from +N medium before washing), 0, 0.5, 2, 4, 8, 12, 24, and 48 h after N deprivation as indicated with red arrows. In a separate experiment, sta6, STA6-C2, STA6-C4, and STA6-C6 were sampled at 0.5, 4, and 48 h after N deprivation, as indicated with blue arrows. The light-green color of an N-free culture at 48 h indicates the cells are chlorotic.