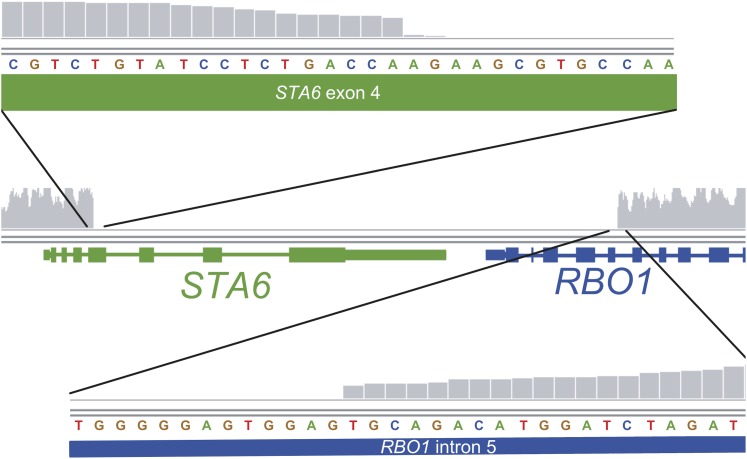
Figure 6.
Resequencing of the sta6 Genome Reveals Extent of Gene Disruption.
The reads were aligned to the C. reinhardtii reference strain (CC-503) using the Burrows-Wheeler Aligner and displayed via the Integrative Genomics Viewer. The depth of coverage, indicated in the figure by vertical gray bars on a scale from 0 to 100, drops off precipitously at the boundaries of the disrupted genes. The breakout tracks above and below display the left and right boundaries, respectively, magnified to the nucleotide level. Gene models for STA6 and RBO1 are shown with exons represented by thick bars and introns represented by thin bars. The nucleotide track indicates the reference sequence at these loci.

