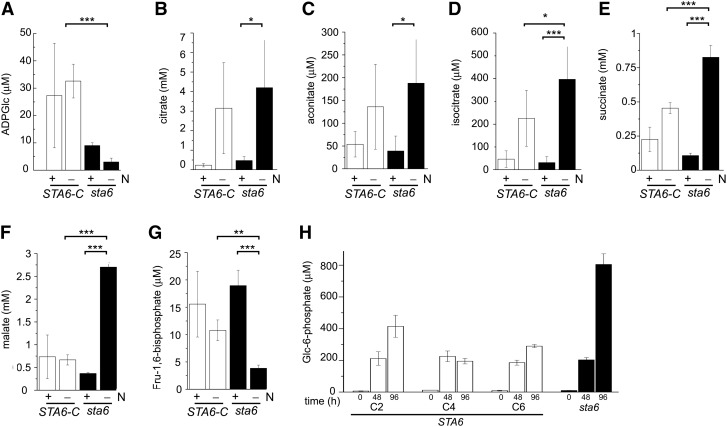
Figure 9.
Metabolite Profiles in sta6 and STA6-Complemented Strains Are Consistent with Predictions from Transcriptomes.
(A) to (G) sta6 (black) was grown in six independent cultures, and STA6-C (white) comprises duplicate cultures each of STA6-C2, STA6-C4, and STA6-C6. Strains were cultured in +N to a density of 4 × 10⁶ cells mL−1 before transferring to +N and –N cultures to a final cell density of 2 × 10⁶ cells mL−1. Samples were taken at 48 h after transfer for metabolite measurement. Significance was assessed by pairwise Student’s t test. P value correction was performed using the Bonferroni correction method (*P < 0.05, **P < 0.01, and ***P < 0.001). Error bars represent one sd.
(H) sta6 (black) and STA6-C2, STA6-C4, and STA6-C6 (white) were each grown in triplicate in +N to a density of 4 × 10⁶ cells mL−1 before transferring to –N to a final cell density of 2 × 10⁶ cells mL−1. Samples were taken at 0, 48, and 96 h after transfer for Glc-6-P measurement. Error bars represent one sd.

