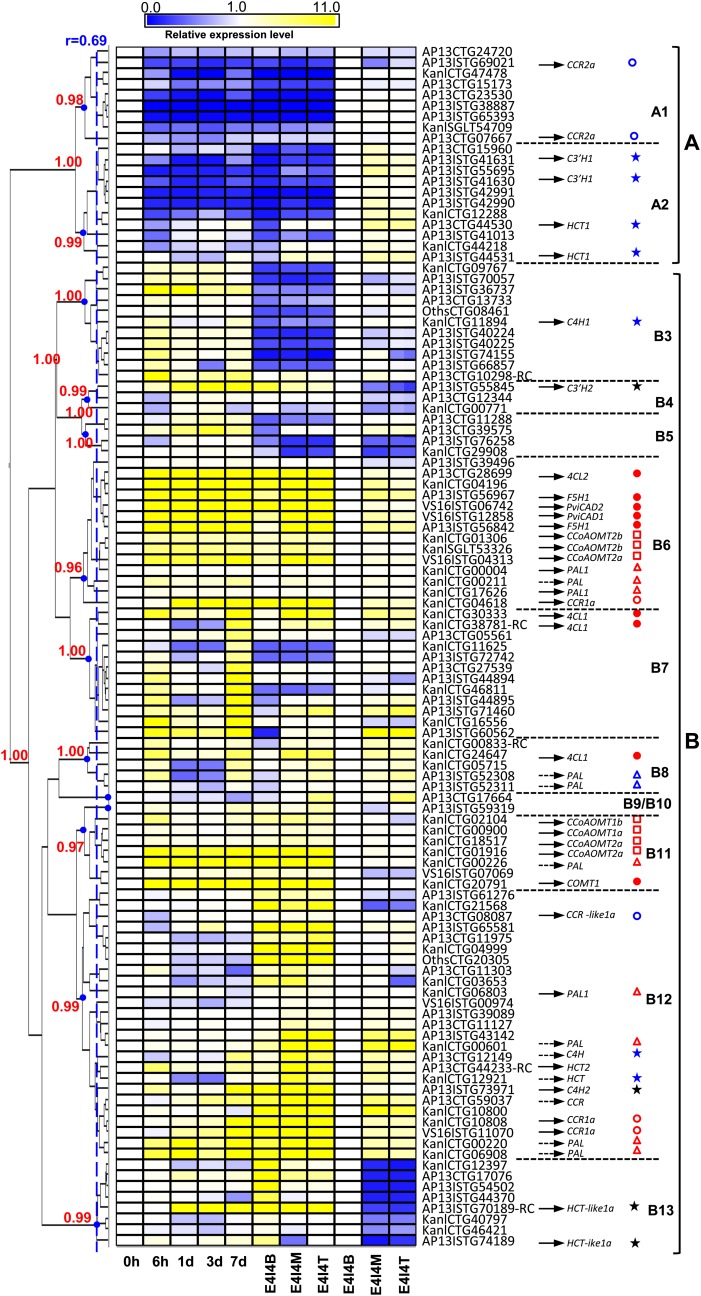
Figure 5.
Clustering of Expression Patterns of Putative Phenylpropanoid/Monolignol Biosynthetic Genes in Switchgrass, as Determined by Microarray Analysis.
Normalization for clustering was done in two ways: first, the expression levels in the top and middle of the fourth stem internode and in induced suspension cells at different times postinduction were normalized to the time zero value for the cell cultures; second, the values for the middle and top of the internode were normalized to the value for the bottom of the internode. B, M, and T are bottom, middle, and top sections of the E4I4 internode, respectively. Black arrows indicate the cloned ESTs that have the highest sequence identity to the corresponding PviUTs in the database. Yellow and blue colors indicate increased or reduced expression levels, respectively, relative to those in the samples (T0 culture or bottom internode) used for normalization (expression value = 1). The heat map of transcript-level patterns was generated using MultiExperiment Viewer software (Saeed et al., 2003) with AU P value (red numbers on the left) support calculated by pvclust (Suzuki and Shimodaira, 2006). At a correlation coefficient (r) cutoff of 0.69 with AU P values higher than 0.95, the expression patterns are clustered into 13 groups (A1 to B13). The expression patterns of different genes are indicated by different-colored shapes: F5H1, COMT1, CAD1, PviCAD1, PviCAD2, 4CL1, and 4CL2 (red dots); CCR and CCR-like (red and blue circles); PAL (red and blue triangles); CCoAOMT (red squares); C4H, C3′H, and HCT that are not well induced in the suspension cells (blue stars); C3′H2 and HCT-like1a (black stars). Gene names indicated by dotted lined arrows are the candidates that have not been cloned. Cloned genes (solid lined arrows) are also shown in Supplemental Data Set 2 online. Because of allelic variation, genomic complexity, and EST assembly inaccuracy, one cloned gene may have several top hit PviUTs. When a PviUT has two probe sets on the switchgrass Affymetrix chip designed according to different regions of one EST (see Supplemental Table 1 online), only the probe set with the highest signal is presented in the heat map.

