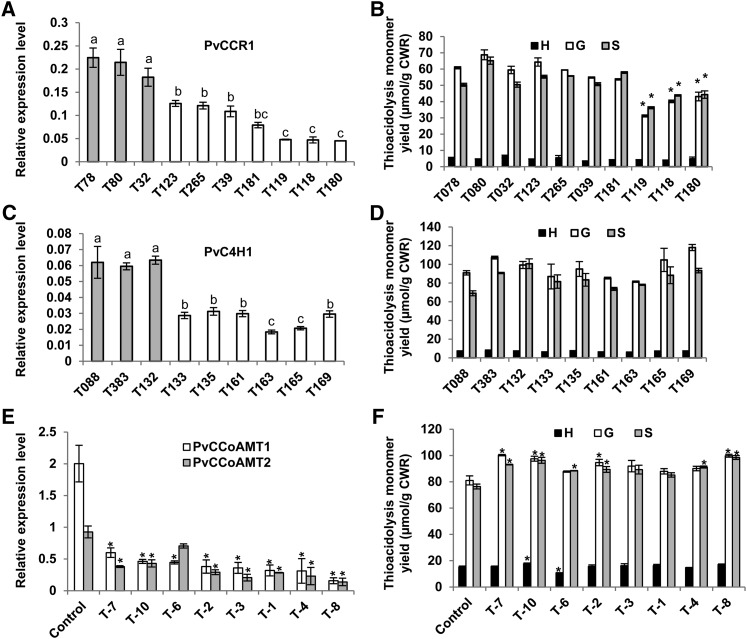
Figure 8.
RNAi-Mediated Silencing of Potential Monolignol Pathway Genes in Switchgrass.
(A, C, E) Transcript levels of the target genes in the C4H1-, CCR1-, and CCoAOMT-RNAi lines. (B, D, F) Corresponding lignin contents measured by thioacidolysis. Black bars represent H units; gray bars represent S units; white bars represent G units. Data are means ± se (n = 3). T78, T80, and T32 are the controls for CCR1-RNAi lines and T88, T88, and T132 are the controls for C4H1-RNAi lines. The controls for CCoAMT-RNAi lines are labeled as control, and the bars show average data from three clonally derived biological replicates. Letters indicate significant differences at the P ≤ 0.05 level. Asterisks indicate values that were determined by Student’s t test to be significantly different from their equivalent control (P < 0.05).

