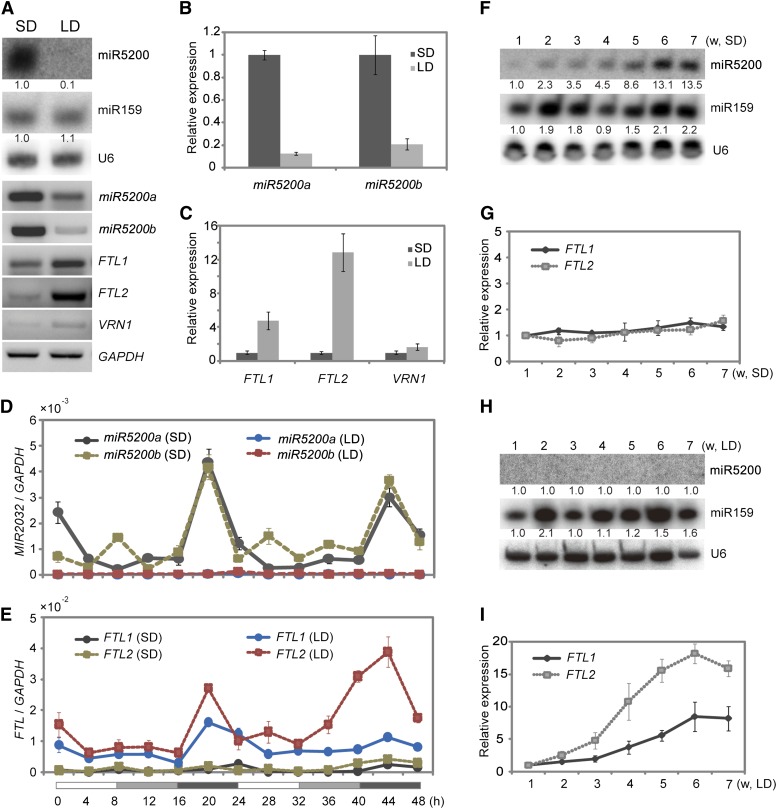
Figure 3.
Photoperiod Affects miR5200 Expression.
(A) Mature miR5200 (by RNA gel blots), pri-miR5200, and flowering-time genes (by RT-PCR) expression under SDs and LDs. The numbers below each miRNA gel blot denote fold changes relative to the miRNA level under SDs.
(B) qPCR analysis of pri-miR5200 in B. distachyon plants under SDs and LDs.
(C) qPCR analysis of the indicated flowering gene expressions in SDs and LDs.
(D) Diurnal expression patterns of MIR5200a and MIR5200b in B. distachyon under SDs and LDs.
(E) Diurnal expression patterns of FTL1 and FTL2 under SDs and LDs. Each point represents the average of three technical replicates, and the error bars indicate repeat sd. The white and black bars along the horizontal axes represent light and dark periods, respectively. The numbers below the horizontal axes indicate the time in hours.
(F) and (G) Growth stage–dependent expressions of miR5200 (F) and its target genes (G) in SDs. Numbers below each miRNA gel blot indicate fold changes relative to the miRNA level in 1-week SD plants. w, weeks.
(H) and (I) Growth stage–dependent abundance of miR5200 (H) and its target gene expression (I) under LDs. Each point represents the average of three biological replicates, and error bar indicates sd. GAPDH was used as an internal control for normalization of qPCR results, and U6 was served as loading control for RNA gel blots. Numbers below each miRNA gel blot indicate the fold changes relative to the miRNA level in 1-week-old plants under LDs.

