Figure 1.
HOS1 Regulates FLC Transcription at the Chromatin Level.
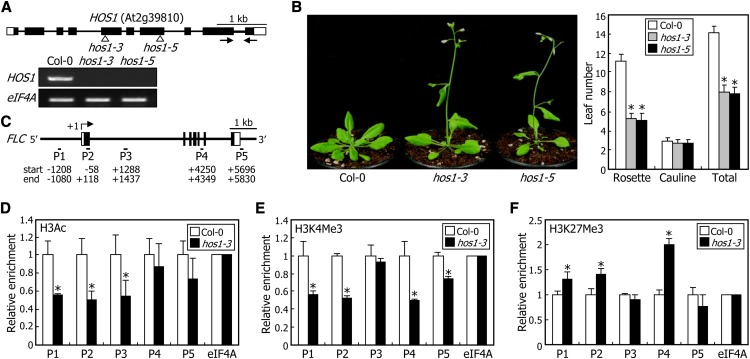
(A) Isolation of hos1 mutants. In the hos1-3 and hos1-5 mutants, one copy of the T-DNA element is inserted in the 5th and 7th exons of the HOS1 gene, respectively (top panel). Black boxes represent exons, and white boxes represent untranslated regions. Black arrows indicate the primer pair used for RT-PCR. HOS1 expression was examined by RT-PCR using total RNA samples extracted from 10-d-old whole plants grown on MS-agar plates (bottom panel). The eIF4A gene was used as the RNA quality control.
(B) Flowering times of hos1 mutants. Five-week-old plants grown in soil under LDs were photographed (left panel). The leaf numbers of 20 plants were averaged for each plant genotype and statistically treated using a Student’s t test (*P < 0.01) (right panel). Bars indicate se.
(C) Structure of the FLC gene. The sequence regions marked by P1 to P5 indicate regions examined in the ChIP assays. Numbers indicate residue positions relative to the transcription start site. Black boxes indicate exons, and white boxes denote untranslated regions.
(D) to (F) Relative levels of histone modifications in FLC chromatin. ChIP assays were performed using anti-H3Ac (D), anti-H3K4 trimethylation (E), and anti-H3K27Me3 (F) antibodies. Plants grown on MS-agar plates for 10 d under LDs were used for chromatin preparation. An eIF4A DNA fragment was used for normalization. Four measurements were averaged for each plant genotype and statistically treated using a Student’s t test (*P < 0.01). Bars indicate se.
[See online article for color version of this figure.]

