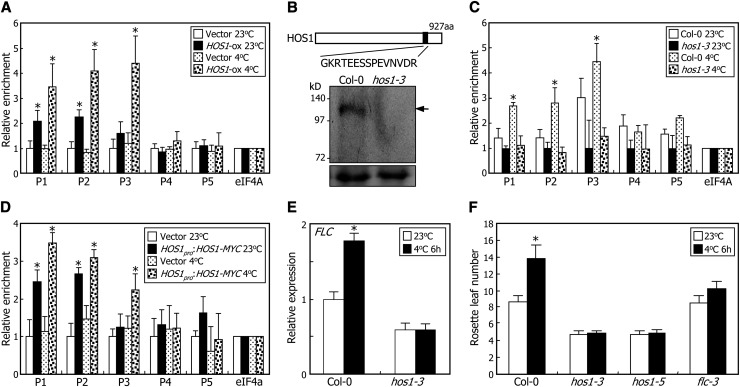
Figure 2.
Chromatin Binding of HOS1 Induces FLC Expression under Cold Stress.
For the ChIP assays, biological triplicates were averaged for each measurement and statistically treated using a Student’s t test (*P < 0.01). Bars indicate se.
(A) ChIP assays of HOS1 binding to FLC chromatin using MYC-specific antibody. ChIP assays were conducted as described in Figure 1, using an anti-MYC antibody. The HOS1-ox transgenic plants grown on MS-agar plates at 23°C for 10 d were further grown at either 23°C or 4°C for 2 d before harvesting plant materials. The genomic DNA sequences examined in the ChIP assays were identical to those described in Figure 1C. Transgenic plants harboring the 6xMYC-pBA vector alone were used as control plants.
(B) Schematic illustration of anti-HOS1 antibody production. A peptide region covering residues 796 to 810 of HOS1 protein was selected for the epitope (black box). Nuclear proteins extracted from Col-0 plants and hos1-3 mutants were used for examination of anti-HOS1 antibody specificity. HOS1 proteins were immunologically detected using the anti-HOS1 antibody. Arrow indicates endogenous HOS1 protein. Parts of Coomassie blue–stained gels are shown at the bottom as loading control. aa, amino acids.
(C) ChIP assays of HOS1 binding to FLC chromatin using HOS1-specific antibody. ChIP assays were conducted as described in Figure 1, using an anti-HOS1 antibody. Chromatin extracts from Col-0 and hos1-3 plants were used for the ChIP assays. The conditions for the cold treatments were identical to those described in (A).
(D) ChIP assays using HOS1pro:HOS1-MYC transgenic plants. ChIP assays were performed using an anti-MYC antibody as described in Figure 1. The conditions for the cold treatments were identical to those described in (A). Transgenic plants harboring the 6xMYC-pBA vector were used as control plants.
(E) Effects of intermittent cold on FLC expression. Plants treated with intermittent cold for 6 h at dawn for 15 d after germination were used for extraction of total RNA. Levels of FLC mRNA were determined by qRT-PCR. Biological triplicates were averaged for each plant genotype and statistically treated using a Student’s t test (*P < 0.01). Bars indicate se.
(F) Effects of intermittent cold on flowering time. Plants were treated with intermittent cold for 6 h at dawn, each day until flowering. Rosette leaves of 15 plants were counted for each plant genotype and statistically treated using a Student’s t test (*P < 0.01). Bars indicate se.

