Figure 1.
Mutations to HOS1 Result in a Long-Period Circadian Phenotype across a Range of Physiological Temperatures and Light Conditions.
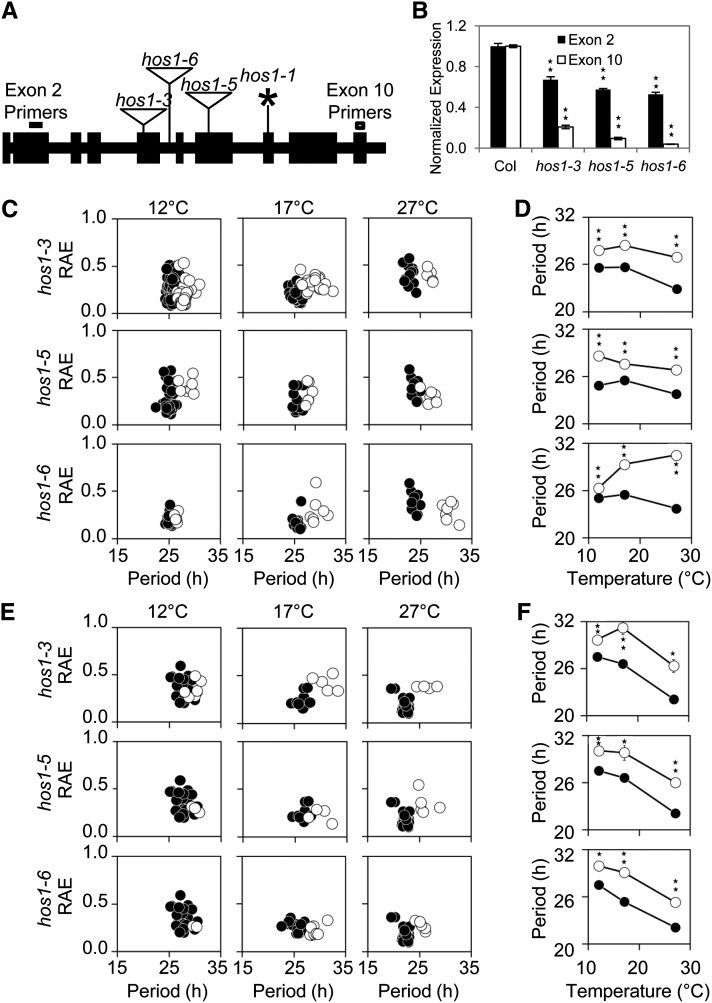
(A) Schematic diagram showing positions of the hos1 mutations across the HOS1 locus. Exons are shown in black boxes and introns in black lines. The position of the hos1 mutations and allele designations are labeled. Triangles represent T-DNA insertions and the asterisk represents point mutations. The primer positions in exons 2 and 10 are marked to illustrate the positions of qPCR primers used to produce the data in Figure 1B.
(B) qPCR data showing reduced levels of HOS1 mRNA expression in each of the hos1 mutants studied. Primers for exon 2 (dark gray bars) are located upstream of and exon 10 (white bars) are located downstream of all hos1 mutations studied (see [A]). Seedlings were grown for 10 d before being harvested at dawn. Data are averages of biological triplicate ± se normalized for transcript abundance to UBQ10. Stars indicate significant difference to the respective wild type as measured by Student’s t test where one star indicates P ≤ 0.05 and two stars P ≤ 0.01.
(C) to (F) Delayed fluorescence assays comparing the wild type (Col) to the hos1 alleles. Seedlings were entrained for 7 d in 12L:12D white-light cycles at 22°C before transfer to experimental conditions of constant 12, 17, or 27°C and constant red light ([C] and [D]) or constant blue light ([E] and [F]). Delayed fluorescence was then measured in several hos1 mutants (white circles) compared with wild-type data (Col, black circles).
(C) and (E) Plots showing period estimations produced via mathematical analysis plotted versus RAE for the wild type (Col) versus the hos1 mutants. Data are from individual wells containing 10 to 20 seedlings.
(D) and (F) Plot illustrating the effect of temperature on the variable weighted mean of the period for the wild type (Col) versus hos1 mutants. Data are variable weighted mean ± se. Stars indicate significant difference to the respective wild type as measured by Student’s t test where one star indicates P ≤ 0.05 and two stars P ≤ 0.01.

