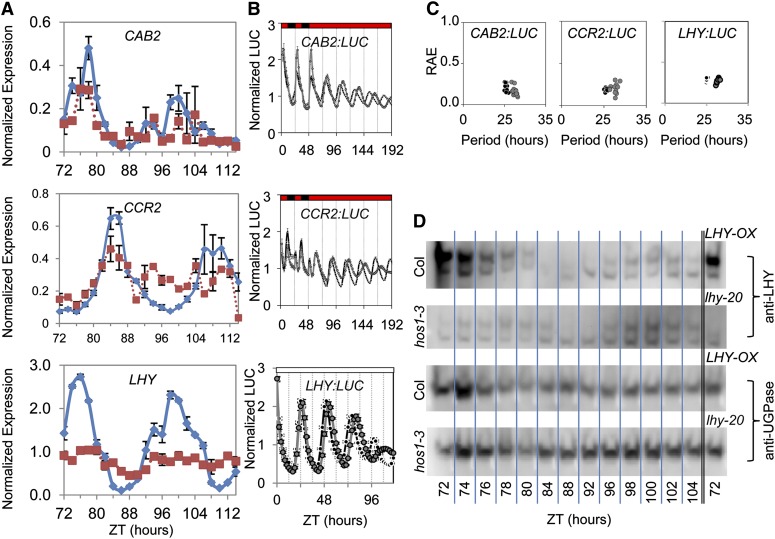
Figure 4.
hos1 Mutants Exhibit Long Period but Robust Protein and Promoter Rhythms Despite Poor mRNA Rhythm Robustness.
(A) The expression of endogenous CAB2, CCR2, and LHY in the wild type (Col) and hos1-3 in constant red light (see Methods). Data are the average of the three biological repeats ± se. Transcript abundance levels were normalized to ACT7. Samples were taken at the Zeitgeber time (ZT) indicated. Blue diamonds are data from Col, whereas red squares show data from hos1-3.
(B) Plots to show the normalized mean CAB2:LUC, CCR2:LUC, and LHY:LUC luminescence profiles for the wild type and hos1-3 mutant. Data are presented as means ± se. Transgenic seedlings containing the CAB2:LUC or CCR2:LUC reporter were entrained for 7 d in 12L:12D white-light cycles at 22°C before transferred to experimental conditions of constant 17°C and 2 d of 12L:12D red-light cycles followed by 6 d of constant red light. Transgenic seedlings containing the LHY:LUC reporter were entrained for 6 d in 12L:12D white-light cycles at 22°C before transferred to experimental conditions of constant white light at room temperature. hos1-3 (gray filled circles) is compared with wild-type data (black filled circles).
(C) Plots to show the period estimations for CAB2:LUC, CCR2:LUC, and LHY:LUC versus RAE for the wild type versus the hos1-3 mutant.
(D) Immunoblot analysis showing endogenous LHY levels in the wild type (Col) compared with hos1-3, with LHY-OX and lhy-20 lines as positive and negative controls, respectively. The blots were reprobed using an antibody against UGPase for the loading control. Plants were grown for 7 d under 12L:12D white-light cycles at 22°C followed by 2 d in 12L:12D red-light cycles at 17°C before being transferred to constant red light at 17°C for sampling at the Zeitgeber time (ZT) times indicated. These images are representative images from technical duplicates.

