Figure 1.
CRY2a Interacts with CIB1 in Response to Blue Light in Yeast Cells.
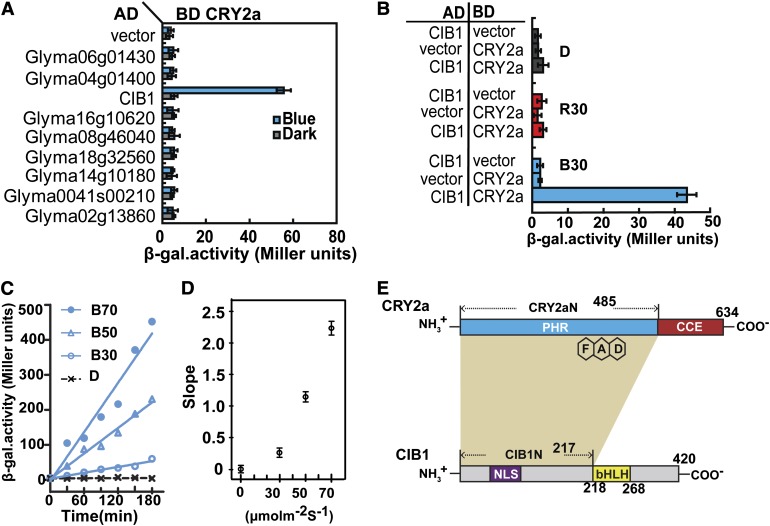
(A) β-Gal assay showing the interaction of CRY2a with CIB1 and other bHLH homologs in yeast cells treated with blue light (30 μmol m−2 s−1) or darkness. AD, activation domain; BD, binding domain.
(B) β-Gal assays showing the interaction of CRY2a and CIB1 in yeast cells treated with red light (R30, 30 μmol m−2 s−1), blue light (B30, 30 μmol m−2 s−1) or darkness (D) for 2 h. Yeast cells expressing various baits and preys are indicated. Means of three independent replicates and sd are shown ([A] and [B]).
(C) β-Gal assay showing the interaction of CRY2a and CIB1 in response to blue light of different fluence rates (D, darkness; B30, 30 μmol m−2 s−1; B50, 50 μmol m−2 s−1; B70, 70 μmol m−2 s−1) for the durations indicated. Increased β-gal activities of the indicated samples fitted by linear regression are shown.
(D) Slopes of linear regression curves of different fluence rates as shown in (C). The means (±sd) of three replicates of individual samples are plotted to show the metric of association kinetics in response to fluence rates of blue light (Jonckheere-Terpstra trend analysis by SPSS program, P = 0.003, n = 3).
(E) Schematic representation depicting the domains of CRY2a and CIB1 that are required for the CRY2a–CIB1 interaction (ocher shade).

