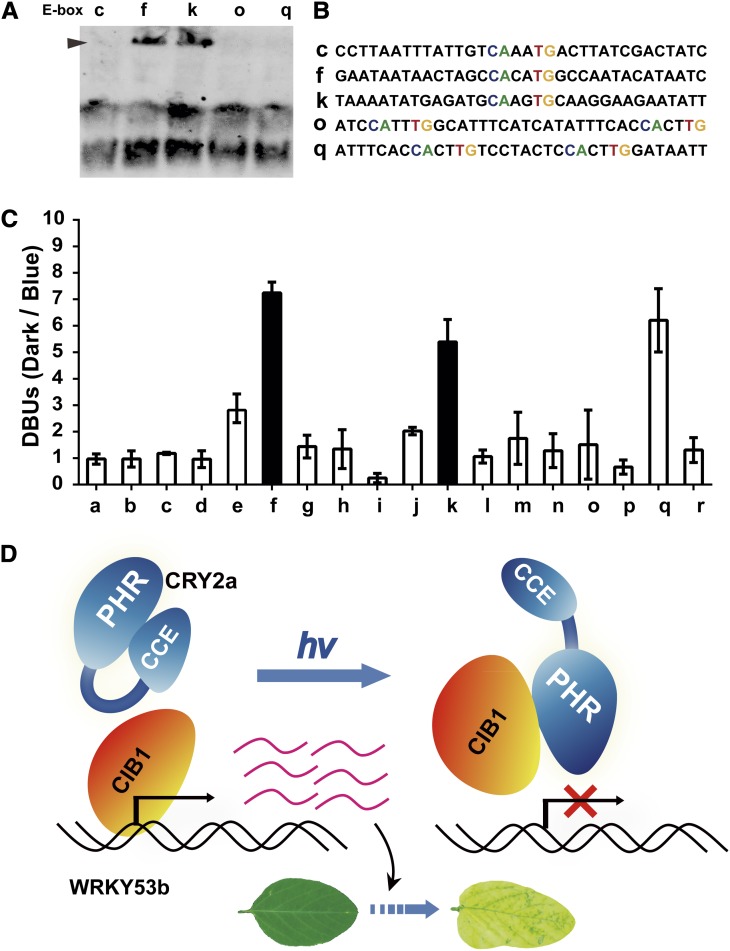
Figure 8.
Blue Light Suppresses the Interaction of CIB1 with Specific Regions of WRKY53b Chromatin.
(A) EMSA shows the direct interaction of CIB1 with the E-box sequences of the f and k regions of WRKY53b chromatin. See Figure 7 for the relative location of each region of the WRKY53b chromatin shown.
(B) The sequences of DNA probes used in (A).
(C) A comparison of the affinity of CIB1 for each region of the WRKY53b chromatin in response to blue light. Three-week-old plants grown in SD photoperiods (8 h light/16 h dark) were transferred to dark for 18 h, transferred to blue light (22 μmol m−2 s−1), or left in darkness until sample collection. The first trifoliolates were collected for ChIP analysis. DBUs were calculated by the formula: [IP of (CIB1/WT)/input of (CIB1/WT) of dark-treated sample]/[IP of (CIB1/WT)/input of (CIB1/WT) of blue light–treated sample], with sd (n = 3) shown. The light dependence of the interaction of CIB1 to the a, f, or k region of the WRKY53b chromatin has a P value of 0.8, 0.002, or 0.007, respectively (Student’s t tests). The f and k regions that show decreased interaction with CIB1 in response to blue light are highlighted by black. WT, the wild type.
(D) A working model depicting CRY2a-mediated blue light suppression of the CIB1-dependent activation of leaf senescence. PHR, photolyase homologous region; CCE, CRY C-terminal extension.

