Figure 2.
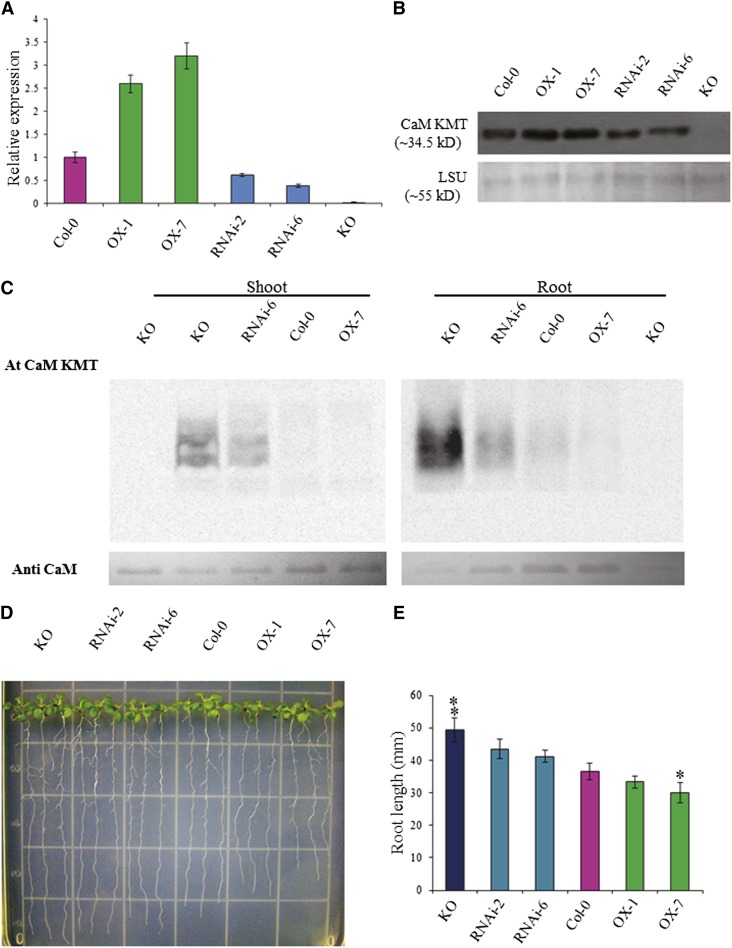
Molecular and Phenotypic Analysis of T2 Generation CaM KMT OX, RNAi, and KO Mutant Lines.
(A) CaM KMT transcript in seedlings of Col-0, OX-1, OX-7, RNAi-2, RNAi-6, and KO lines was detected by qRT-PCR. Data are the mean ± sd of three independent experiments with different biological samples, with four replicates for each sample in every experiment.
(B) CaM KMT protein accumulation in seedlings of Col-0, OX-1, OX-7, RNAi-2, RNAi-6, and KO lines as detected by immunoblotting with a CaM KMT-specific antibody. The bottom panel shows the accumulation of the Rubisco LSU as a loading control.
(C) Methylation state of calmodulin in Col-0, OX-7, RNAi-6, and KO lines as detected by incubation of 20 µg total plant protein from shoots and roots of 4-week-old seedlings with (+) or without (−) Escherichia coli–expressed Arabidopsis CaM KMT protein in the presence of [3H-methyl]-S-Adenosyl methionine. Samples were subjected to SDS-PAGE, and after transfer to a polyvinylidene difluoride membrane, radiolabeled methyl group incorporation was detected using a phosphor screen.
(D) Phenotypic analysis of root growth of seedlings of Col-0, OX-1, OX-7, RNAi-2, RNAi-6, and KO lines. Four-day-old seedlings were placed on AGM and allowed to grow vertically for an additional 6 d and then photographed. Three representative seedlings are shown for each line.
(E) The root length of seedlings of the Col-0, OX-1, OX-7, RNAi-2, RNAi-6, and KO lines were measured at 10 d of growth after stratification. After 4 d of growth, the seedlings were transferred and grown in AGM plates vertically for another 6 d. Data presented are the mean of at least 50 individual seedlings of each line ± sd. Asterisks and double asterisks indicate the significant deviation from Col-0 line at P < 0.005 and P < 0.001, respectively, using Student’s t test for pairwise comparison.

