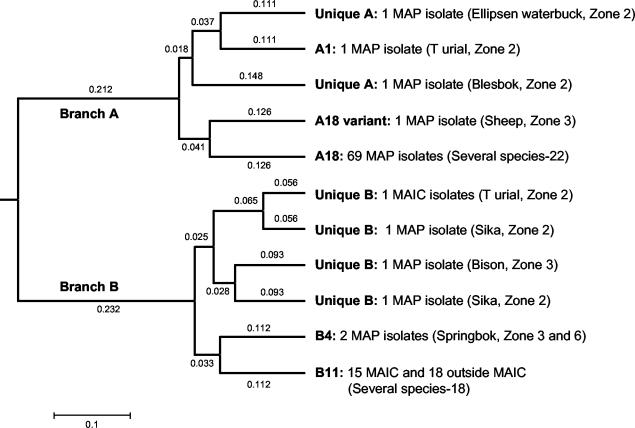
FIG. 1.
Dendrogram showing the distribution of MPIL fingerprints. The assigned fingerprints, isolate identities, and host species are shown. The proportion distance of each cluster is also indicated. MPIL analysis had a Simpson's diversity index of 0.533, indicative of a limited degree of strain discrimination capability. Shannon's diversity index was 1.067. MAP, M. paratuberculosis; MAIC, non-M. paratuberculosis M. avium-M. intracellulare complex; Outside MAIC, mycobacteria outside the M. avium-M. intracellulare complex.

