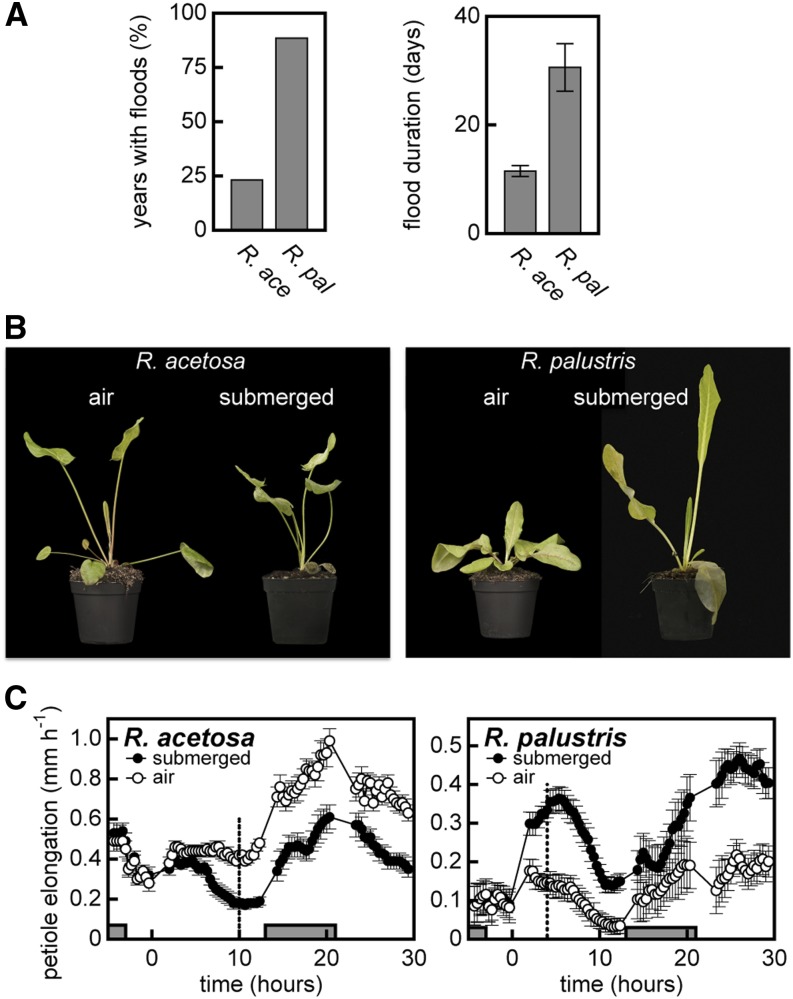
Figure 1.
Growth Strategies and Habitat of Two Wild Rumex Species.
(A) Flooding regime based on data from the Dutch Ministry of Infrastructure and the Environment over the period from 1970 to 1995 at elevation levels where R. acetosa (R. ace) or R. palustris (R. pal) are located. The left bar graph shows the percentage of years with flood occurrence in the growth season (April to September). The right bar graph presents the average (± sem) duration of the most extreme flooding event during the growth season of each year.
(B) Visual representation of the responses of R. acetosa (left) and R. palustris (right) after 10 d of complete submergence.
(C) Petiole elongation rate of the youngest developing leaf (third leaf) (mean ± sem; n = 11 for R. acetosa, n = 18 for R. palustris). Gray bars represent the dark period and the vertical dashed line indicates the sampling time-point for Illumina sequencing.
[See online article for color version of this figure.]

