Figure 2.
RNA-Sequencing Pipeline and Analysis.
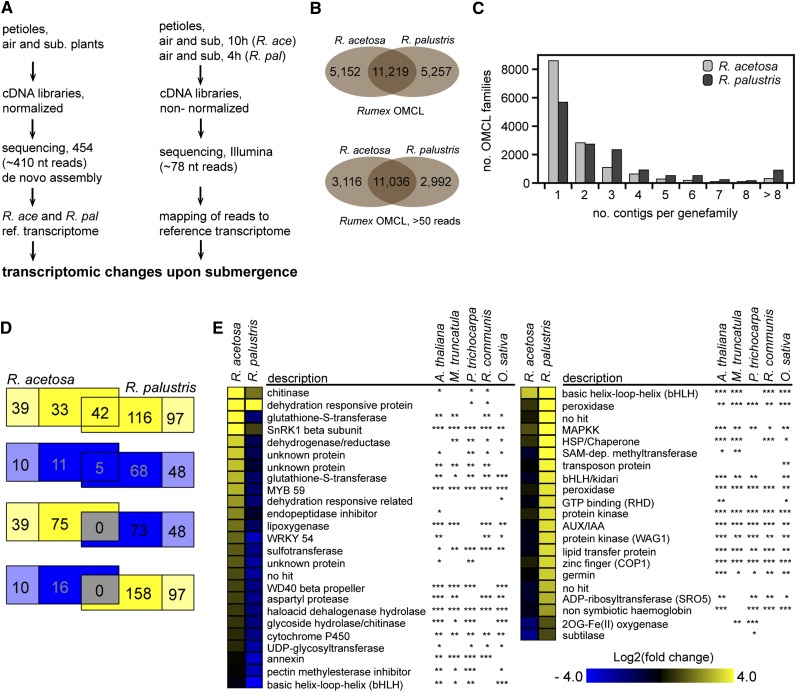
(A) Experimental, analytical, and bioinformatics workflow used to characterize and quantify transcriptomic changes upon submergence.
(B) Distribution of OMCL families from R. acetosa and R. palustris of either all identified OMCL families, or those with more than 50 sequence reads in at least one treatment. The latter was used for subsequent analysis.
(C) OMCL family size distribution of families with more than 50 sequence reads in at least one treatment.
(D) Venn diagram of differentially expressed OMCL families upon submergence, where yellow is up, blue is down, and gray the overlap between upregulation and downregulation (adjusted P < 0.01). The pale colors are OMCL families specific to either R. acetosa or R. palustris.
(E) OMCL families with a strong species × treatment interaction (adjusted P < 0.01). Annotation of the OMCL families was based on a discontiguous megablast against five other plant species. *Eval > 10−10; **10−10 < Eval < 10−30; ***Eval < 10−30.

